Life & fun · alternatives · 2026

24 alternatives to Vizipedia
Data visualisation library
Below are 24 products that do a similar job, ranked by how close each is in meaning and then by launch-day votes. Vizipedia launched in 2015; newer entries below may have overtaken it.
- 1

- 2
- 3MMapipedia▲61
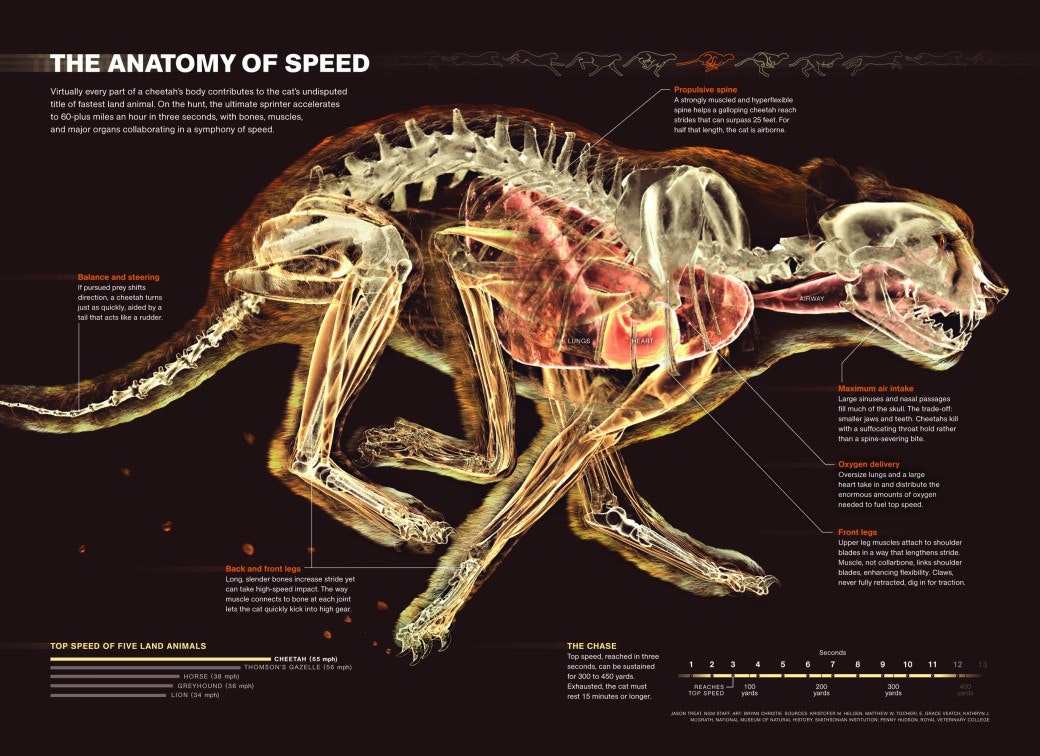
A web platform I've written to make it easy for people to share goespatial time series data and display it on animated heatmaps. There's also a social media component that allows you to write comments, follow, share and like data sets that you want to engage with. You can also download the CSV data and embed animations into your own websites. People uploading datasets can also choose to make money by accepting donations. Please check out the home page for more details: https://mapipedia.com Here are some samples of things created with the platform (press the play button to start…
2019 · its alternatives →
- 4
- 5

- 6

- 7
- 8

- 9

- 10
- 11

- 12

- 13

- 14
 Growthverse▲233
An interactive visualization of marketing tech tools
2015 · growthverse.com · its alternatives →
- 15
- 16

Reference tool for data visualisation
2016 · datavizcatalogue.com · its alternatives →
- 17

Create beautiful product roadmap visualizations
2016 · aha.io · its alternatives →
- 18

- 19
- 20
- 21
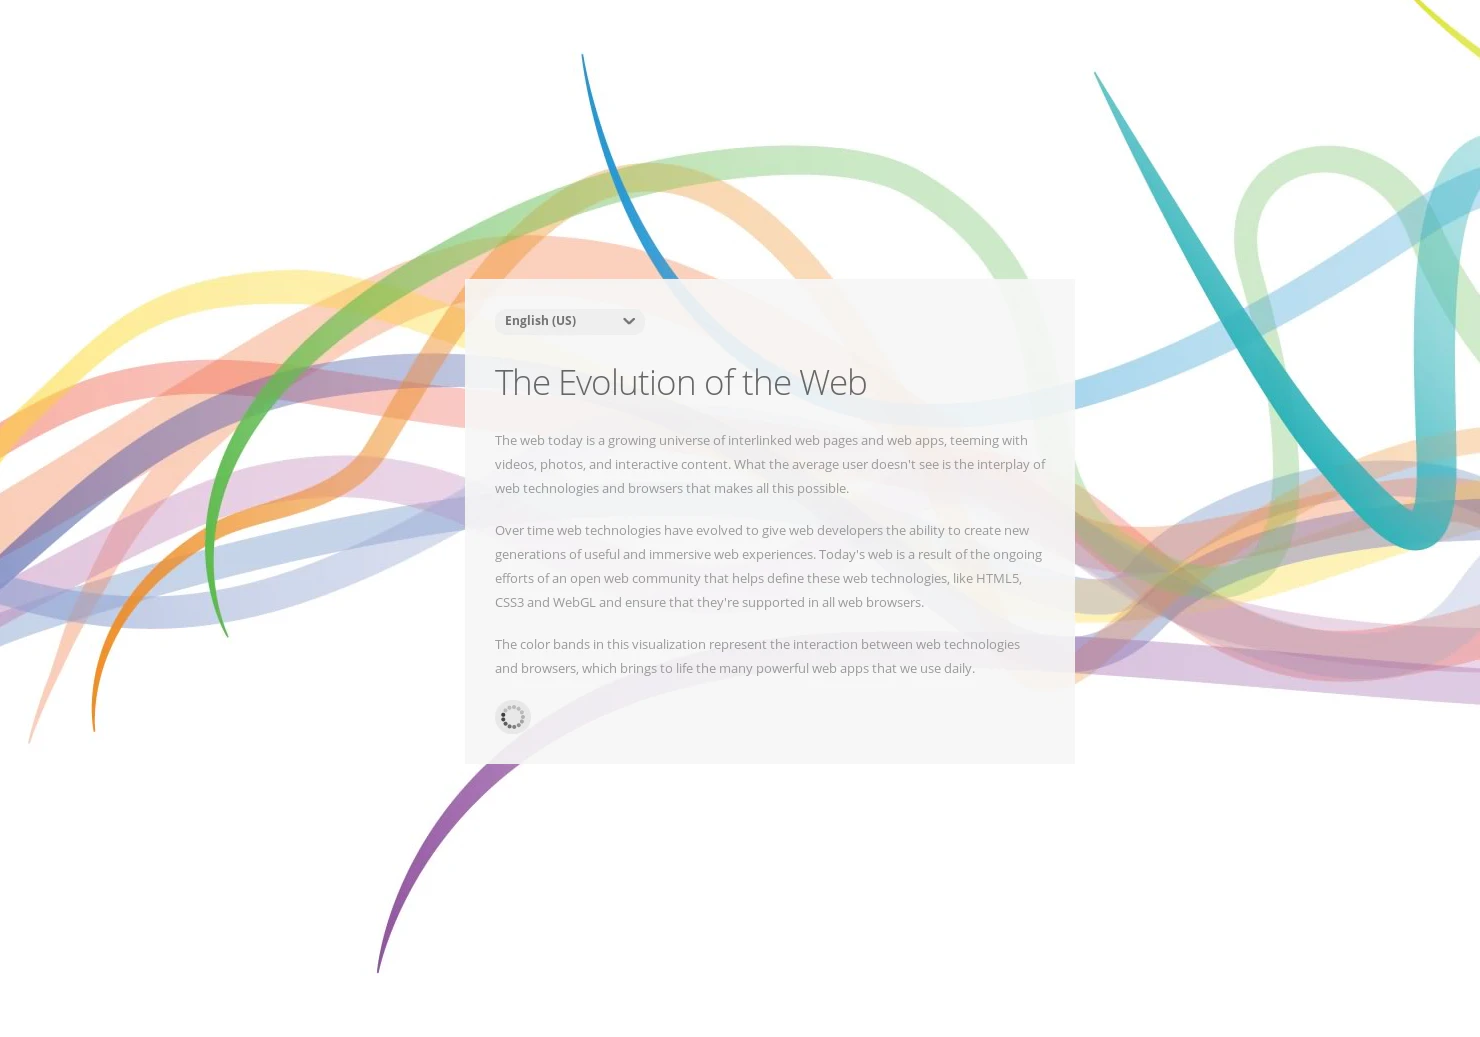
A data visualization about the growth of the web since 1990
2015 · evolutionofweb.appspot.com · its alternatives →
- 22
 Recharts▲155
A composable charting library built on React components
2016 · recharts.org · its alternatives →
- 23

Free chapters from a book by Stephen A. Thomas
2014 · jsdatav.is · its alternatives →
- 24
 Vizician▲77
Drag & drop your data for instant visual data exploration
2022 · vizician.com · its alternatives →
Also compare
Ranked by how close each launch is in meaning, then by votes. Prices were read from each product’s own site when checked and can change. Refine with your own description →