Work · alternatives · 2026

24 alternatives to Vizu
Gain clarity and build a shared understanding
Below are 24 products that do a similar job, ranked by how close each is in meaning and then by launch-day votes.
- 1

- 2
 Vizician▲77
Drag & drop your data for instant visual data exploration
2022 · vizician.com · its alternatives →
- 3

Social and marketing data visualization.
2018 · brandwatch.com · its alternatives →
- 4VO
vizzu - Library for animated data visualizations and data stories
2021 · lib.vizzuhq.com · its alternatives →
- 5

- 6

Visualize data from your boards, CSV, and other apps
2019 · its alternatives →
- 7

Create pro-level graphs that drive actions
2024 · graphy.app · its alternatives →
- 8
 Vizzu▲225
Open-source JS library to build animated charts with ease
2022 · vizzu.io · its alternatives →
- 9

- 10

- 11
 Stately Viz▲236
Visualize, simulate, and inspect your state machines
2021 · stately.ai · its alternatives →
- 12

- 13

- 14

- 15

- 16

- 17
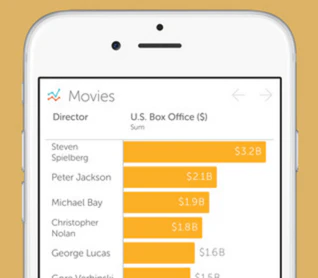
- 18

- 19
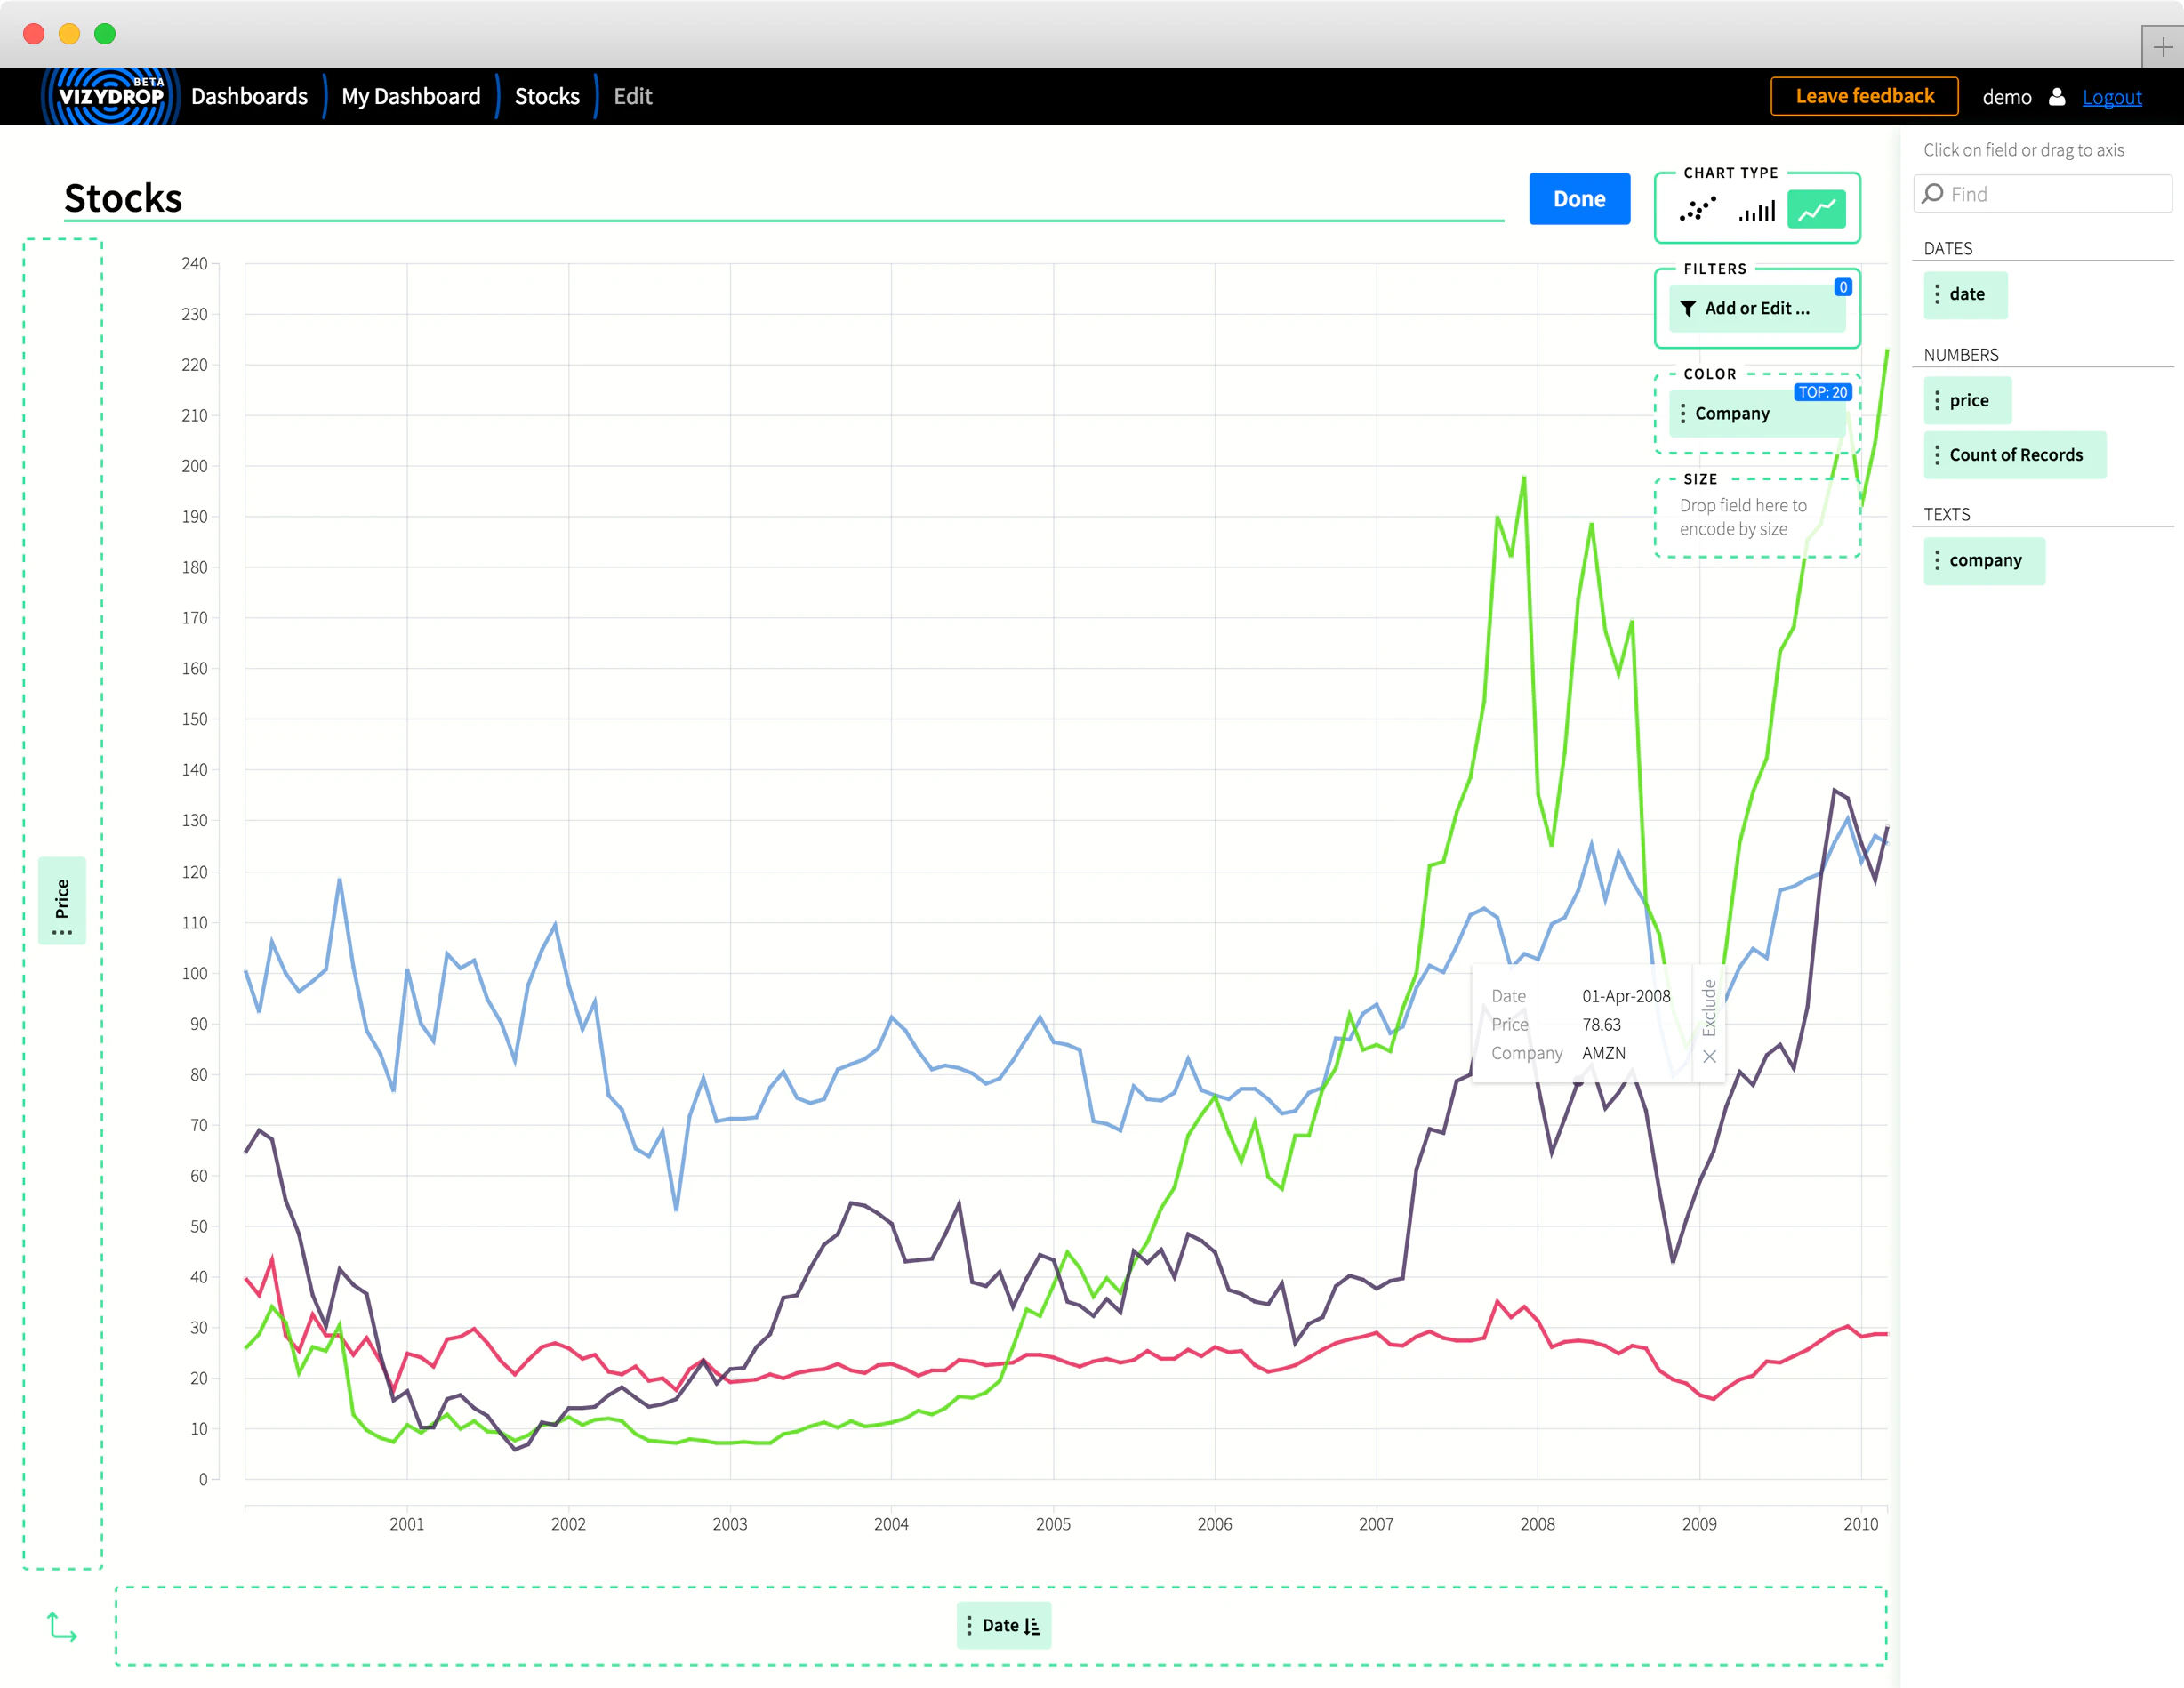
- 20
 vizGPT▲80
Make contextual data visualization with Chat interface
2023 · vizgpt.ai · its alternatives →
- 21

VizGPT provides a chat interface to make and edit data visualizations. Not only can it create visualization with natural language query, but you can continue transform or edit your visualization in context. You can build complex visualization with chatting step by step instead of design a large prompt at once. There exist lots of great visualization product in the world, such as tableau, pygwalker. Traditional drag-and-drop visualization tool is hard to use for people who are not familiar with configs and viz/data transformations. For example, making a heatmap in tableau requires to…
2023 · github.com · its alternatives →
- 22
 BStreams▲62
Interactive, easy, responsive data visualization & analysis
2021 · bstreams.io · its alternatives →
- 23

A framework for 3D geospatial visualization in the browser - UDST/vizicities
2016 · github.com · its alternatives →
- 24VV
2017 · donnemartin.com · its alternatives →
Also compare
Ranked by how close each launch is in meaning, then by votes. Prices were read from each product’s own site when checked and can change. Refine with your own description →