Dev tools · alternatives · 2026

24 alternatives to Vizzly
Build dashboards your users can customize
Below are 24 products that do a similar job, ranked by how close each is in meaning and then by launch-day votes. Vizzly launched in 2023; newer entries below may have overtaken it.
- 1

- 2
 Vizzu▲225
Open-source JS library to build animated charts with ease
2022 · vizzu.io · its alternatives →
- 3

How to use the Plotly.js React component.
2016 · academy.plot.ly · its alternatives →
- 4

- 5

Build dashboards with ease of canvas & power of code
2024 · holistics.io · its alternatives →
- 6

Prebuilt customizable tools to access business data and APIs
2019 · rows.com · its alternatives →
- 7VO
vizzu - Library for animated data visualizations and data stories
2021 · lib.vizzuhq.com · its alternatives →
- 8

Hi folks, My friend Sami and I recently built Vizly, a Mac application that allows anyone to query their databases using plain English. Vizly is built on Llama 2, llama.cpp, and runs fully on-prem (edit: meaning everything is local and your data never leaves your own computer). We are running two Llama models, one for natural language to SQL translation, and another that uses the results from the SQL to render visualizations. That means there are no external APIs and all the AI models are running locally on your MacBook. We tried to make Vizly very easy to share as well. Every Vizly instance…
2023 · vizly.fyi · its alternatives →
- 9

Social and marketing data visualization.
2018 · brandwatch.com · its alternatives →
- 10
 DashGPT▲287
I guys, I built this spreadsheet to dashboard tool. You can attach any csv and optionally a prompt for what insights you want it to include, and it reasons over the data and produces a dashboard of different charts. Let me know what y'all think! Demo Video/more here: https://www.producthunt.com/products/spreadsite/launches/das...
2024 · dashgpt.ai · its alternatives →
- 11

- 12
 Webdash▲268
A customizable web dashboard for your web projects
2018 · webdash.xyz · its alternatives →
- 13
 Dashly▲142
Turn your new tab into a dashboard.
Jan 2026 · microsoftedge.microsoft.com · its alternatives →
- 14

- 15
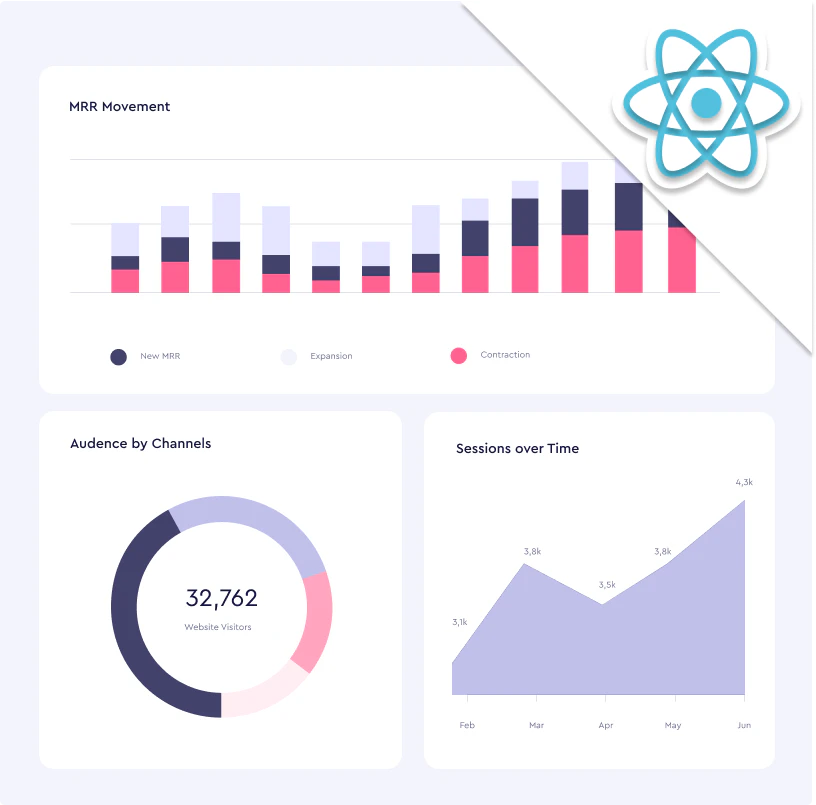
Learn to build a dashboard with React, GraphQL, and Cube.js
2019 · its alternatives →
- 16
 Creately 3.0▲365
The simplest way to visualize ideas, plans & processes
2020 · creately.com · its alternatives →
- 17

- 18

Many JS libraries exist to build graphs on the web (Vega, chartJS, Plotly...). They allow to make charts quickly. But you lose flexibility: you're limited by the options they offer. I just created a gallery with hundreds of graphs made with d3.js and React. - Examples are split by graph types - They all come with explanation and code sandboxes - Gradual complexity to ease the learning curve It took me ages to create this project! Feedback welcome!
2023 · react-graph-gallery.com · its alternatives →
- 19
 Plot.ly▲16
Millions of data teams build with Plotly. Open-source graphing libraries, Dash, and Plotly Studio for interactive data apps in Python.
2014 · plot.ly · its alternatives →
- 20

A collection of composable React components for building interactive data visualizations - FormidableLabs/victory
2016 · github.com · its alternatives →
- 21

- 22

- 23
 Chartbrew▲159
One dashboard to view, create and share your data
2020 · chartbrew.com · its alternatives →
- 24
Also compare
Ranked by how close each launch is in meaning, then by votes. Prices were read from each product’s own site when checked and can change. Refine with your own description →