A ratings visualizer for tv shows
A ratings visualizer for tv shows launched on December 9, 2015 with 13 votes and more than 75% of that year's launches.
In plain words
A ratings visualizer for TV shows that displays how audience ratings change throughout a series. Launched in 2015, the tool helps viewers understand which episodes are considered the best or worst by the audience. It's useful for anyone deciding what to watch, trying to find the strong seasons of a long-running show, or curious about how a series was received over time. The site presents episode ratings in an easy-to-read visual format.
written from the facts on this page · September 2026
Does a similar job
all alternatives → Series GraphDec 2025 · series-graph.coderocket.app · ▲366
See every series & movies true rating at a glance
- AWA web app that charts any TV show's IMDB ratings, by episode2020 · tvchart.benmiz.com · ▲12
View a graph of any TV show

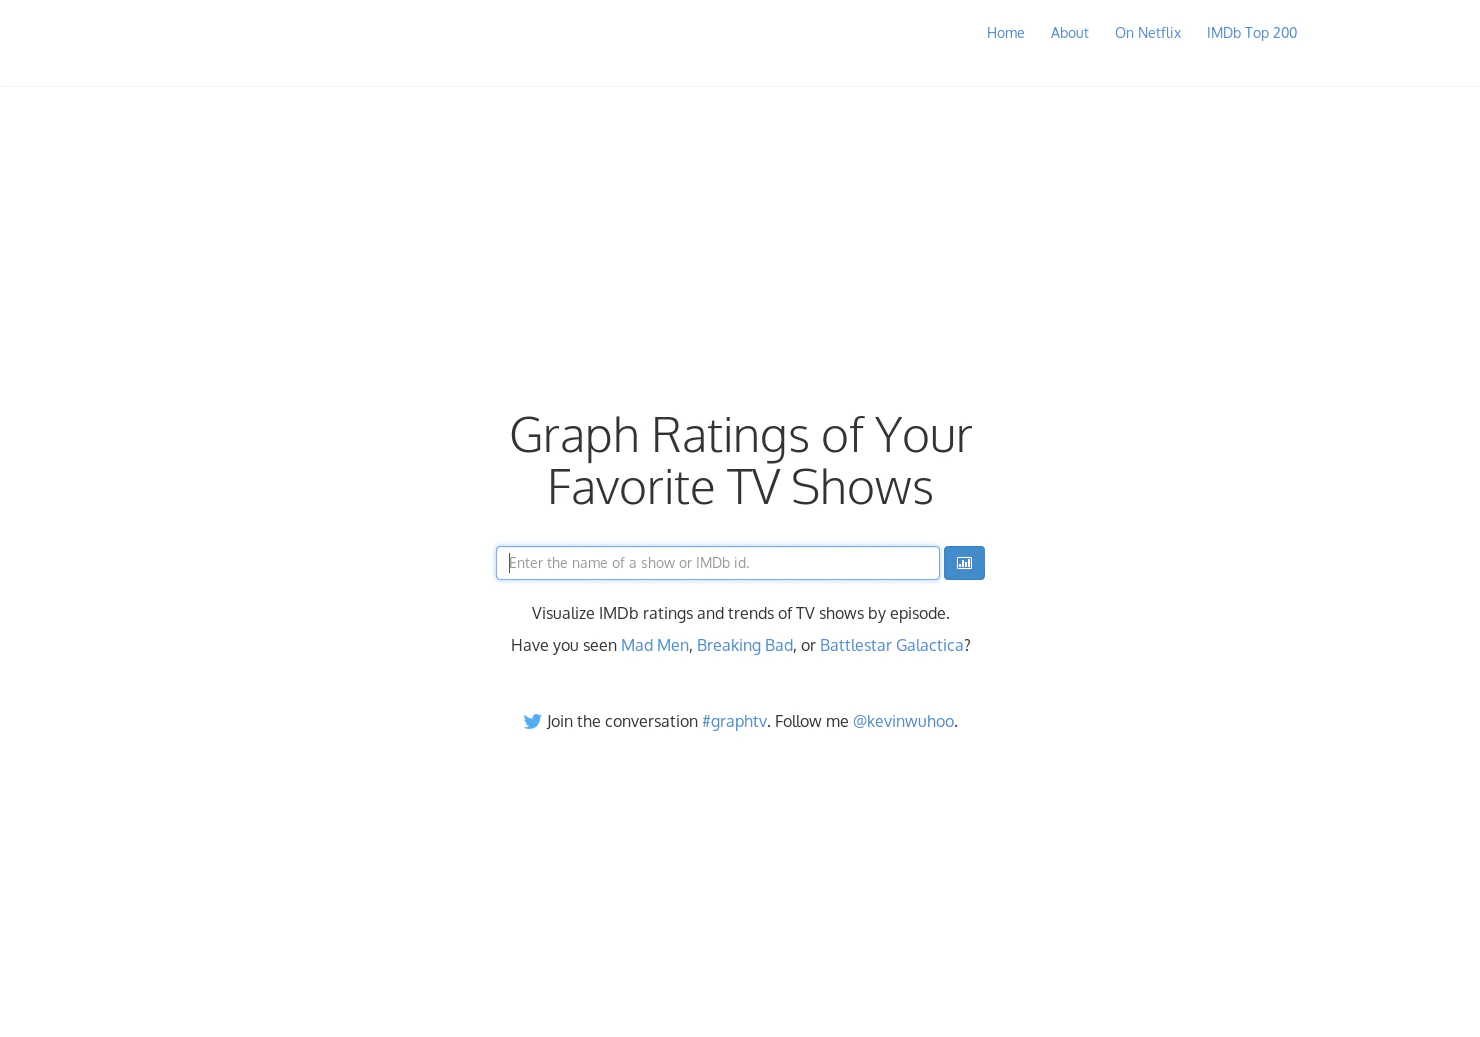 GraphTV2014 · graphtv.kevinformatics.com · ▲73
Visualize IMDb ratings and trends of TV shows by episode.


More life & fun this month
the category →
A free city-building game in your browser. You are the mayor. You know what the city needs. Now get it past the zoning board, the neighbors, the appeals court and the next election.
Life & fun · 2d ago · permit.petercai.com
- IV
Life & fun · 14d ago · tanzaniaeducationproject.org

Turn a phone, tablet or TV into a sign. Type a message and it fills the screen: welcome signs, timers, Wi-Fi passwords and more. No app, no account, free.
Life & fun · 15d ago · bigwords.page

Play a free virtual guitar online with your keyboard or by touch. Slow songs down and see every chord, string and strum. Acoustic, classic, electric and bass.
Life & fun · 9d ago · guitoro.com

Carrier settings from iPhone, Pixel and Galaxy firmware, decoded and compared: APNs, VoLTE, 5G and Wi-Fi Calling per carrier, and what each build changed.
Life & fun · 13d ago · carrierexplode.com

Life & fun · 23d ago · space.bl2.net
Source: Show HN post ↗
Launched alongside, December 2015
the whole month →
- OH
Life & fun · 2015 · openhunt.co