
An interactive, chart-focused Coronavirus Dashboard
A mobile-friendly dashboard to visualize the spread of the Coronavirus Disease (COVID-19) and compare it across different countries.
An interactive, chart-focused Coronavirus Dashboard launched on March 30, 2020 with 5 votes, #1,643 of 4,417 launches that month and more than 50% of that year's launches. The site was still online in September 2026, 6 years on.
Does a similar job
all alternatives →
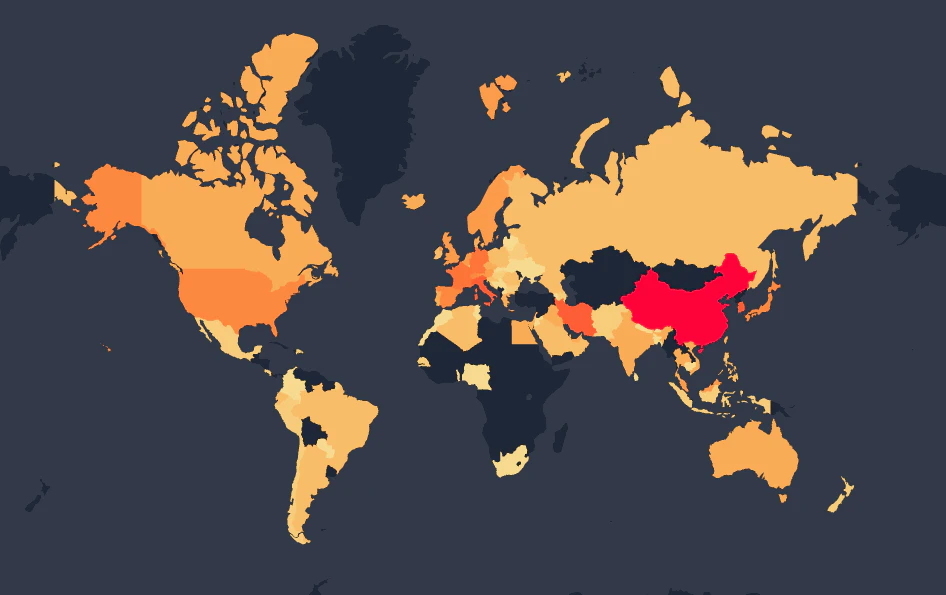
 Coronavirus Spread Animation/Map2020 · coronavirus.dreamonward.com · ▲10
Visualisation of Coronavirus (COVID-19) spread over time on interactive map.
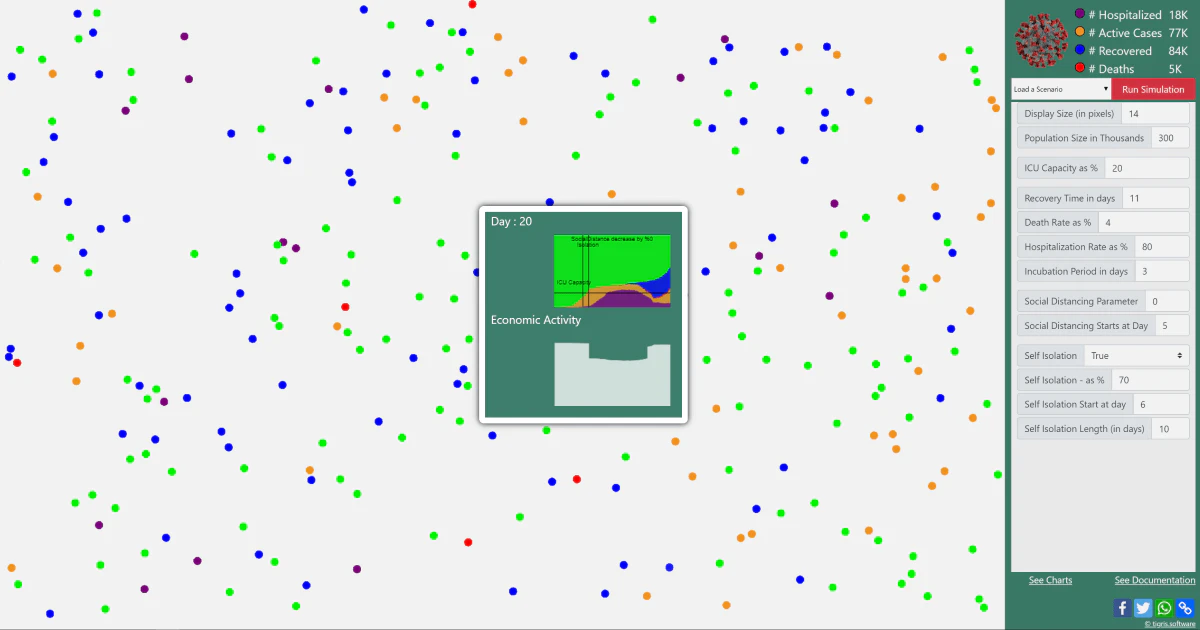
 Open Source Covid19 Dashboard2020 · covid19.locale.ai · ▲18
A minimal & easy to use a version of coronavirus tracker
- CVCorona Virus Outbreak Dashboard for United States2020 · outbreakdashboard.com · ▲25
 Routitude 0.5 - COVID-19 Map & Dashboard2020 · routitude.com · ▲19
Coronavirus statistics and travel restrictions by country
More work this month
the category →
Endless lofi beats composed live in your browser, over pixel-art nights in Paris, Tokyo, New York, Hong Kong, Sydney, San Francisco and more. Free, no sign-up.
Work · 25d ago · loficities.com
 Smooth Recorder▲257
Mac screen recordings that look edited when you hit stop
Work · 19d ago · smoothrecorder.com


Work · 13d ago · readrare.com
Source: Show HN post ↗
Launched alongside, March 2020
the whole month →

 Fraidycat▲807
Life & fun · 2020 · fraidyc.at
 MainStreet▲540
Founders: You're owed $50K. Get it back in 20 minutes 🤝
Commerce · 2020 · mainstreet.com

108 free flat illustrations with customizable characters
Dev tools · 2020 · patterns.page
- TF
Life & fun · 2020 · bingetogether.com