Life & fun · February 29, 2020

Coronavirus Spread Animation/Map
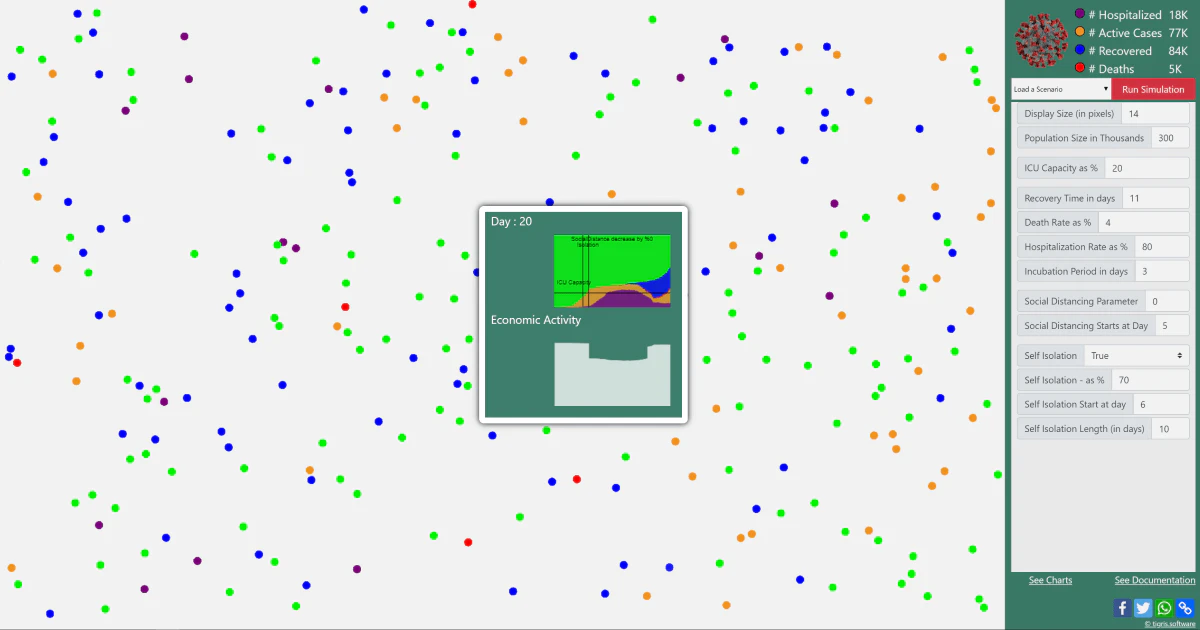
Visualisation of Coronavirus (COVID-19) spread over time on interactive map.
Coronavirus Spread Animation/Map launched on February 29, 2020 with 10 votes, #825 of 3,162 launches that month and more than 75% of that year's launches. The site was still online in September 2026, 6 years on.
In plain words
Coronavirus Spread Animation/Map is a visualization tool that displays the geographic progression of the coronavirus outbreak. Launched in early 2020, it presents data through animated maps and charts to help users track how the virus spread across regions and countries over time. The tool is designed for anyone interested in understanding the pandemic's trajectory through visual representation of confirmed cases and affected areas.
written from the facts on this page · September 2026
Does a similar job
all alternatives →
 CoronaVirus Outbreak Tracker2020 · coronavirusapp.gumroad.com · ▲126
Track coronavirus - COVID-19 outbreak from your menubar.
- TPThe Progression of Coronavirus2020 · gieoon.github.io · ▲10
 An interactive, chart-focused Coronavirus Dashboard2020 · codelike.com · ▲5
A mobile-friendly dashboard to visualize the spread of the Coronavirus Disease (COVID-19) and compare it across different countries.
- CVCorona Virus Outbreak Dashboard for United States2020 · outbreakdashboard.com · ▲25
More life & fun this month
the category →
A free city-building game in your browser. You are the mayor. You know what the city needs. Now get it past the zoning board, the neighbors, the appeals court and the next election.
Life & fun · 2d ago · permit.petercai.com
- IV
Life & fun · 14d ago · tanzaniaeducationproject.org

Turn a phone, tablet or TV into a sign. Type a message and it fills the screen: welcome signs, timers, Wi-Fi passwords and more. No app, no account, free.
Life & fun · 15d ago · bigwords.page

Play a free virtual guitar online with your keyboard or by touch. Slow songs down and see every chord, string and strum. Acoustic, classic, electric and bass.
Life & fun · 9d ago · guitoro.com

Carrier settings from iPhone, Pixel and Galaxy firmware, decoded and compared: APNs, VoLTE, 5G and Wi-Fi Calling per carrier, and what each build changed.
Life & fun · 13d ago · carrierexplode.com

Life & fun · 23d ago · space.bl2.net
Source: Show HN post ↗
Launched alongside, February 2020
the whole month →

- SC
Dev tools · 2020 · grep.app


- PH
Profit Hunt | Discover ideas that make money
Commerce · 2020 · profithunt.co