Life & fun · November 15, 2015
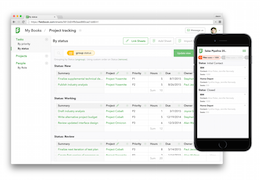
Bitfusion Profiler – Compare application performance across clouds
Bitfusion Profiler – Compare application performance across clouds launched on November 15, 2015 with 25 votes, #1,842 of 4,110 launches that month and more than 75% of that year's launches.
In plain words
Bitfusion Profiler is a performance comparison tool that helps developers evaluate how applications run across different cloud environments. It allows users to benchmark and analyze application behavior on multiple cloud platforms side by side. The tool is designed for developers and DevOps teams who need to optimize cloud deployments and make informed decisions about which cloud infrastructure best suits their applications.
written from the facts on this page · September 2026
Does a similar job
all alternatives →
 An open source performance monitoring tool2024 · github.com · ▲135
Hey HN. We’re Jay and Vadim from Highlight.io (https://highlight.io). We’re building an open source [1] monitoring platform for web applications. Today we’re excited to be sharing a performance tool we’ve been working on, which helps you inspect the latency of code execution from the client to the server. As engineers at past startups, we often had to debug slow queries, poor load times, inconsistent errors, etc... While tools like Jaegar [2] helped us inspect server-side performance, we had no way to tie user events to the traces we were inspecting. In other words, although we had…
 Py-spy – A new sampling profiler for Python programs2018 · github.com · ▲286
Sampling profiler for Python programs. Contribute to benfred/py-spy development by creating an account on GitHub.
 StackImpact – Python Production Profiler: CPU, Memory, Exceptions2017 · github.com · ▲135
DEPRECATED StackImpact Python Profiler - Production-Grade Performance Profiler: CPU, memory allocations, blocking calls, exceptions, metrics, and more - stackimpact/stackimpact-python
 Shed Light on Your Go Binary Bloat with Go Size Analyzer2024 · github.com · ▲87
I've created a powerful tool to help Go developers uncover the hidden giants in their compiled binaries. Go Size Analyzer is like an X-ray machine for your Go executables, revealing: Which dependencies are eating up your binary size Unexpected bloat from standard library or vendor packages Size changes between binary versions with a visual diff Key features that set it apart: Interactive treemap visualizations (check out the demo: https://gsa.zxilly.dev) Slick terminal UI for deep diving into package hierarchies Cross-platform support (works on Linux, macOS, and Windows binaries)…
 Perforator – cluster-wide profiling tool for large data centers2025 · github.com · ▲78
Hey HN! We are happy to share Perforator – our internal cluster-wide profiler with great support for native languages and a built-in AutoFDO pipeline to simplify sPGO builds. Perforator allows you to profile most binaries without having to recompile or adjust the build process. We use it at Yandex to profile each pod inside a large cluster at modest speed (99Hz), collecting petabytes of profiles every day. There's a blog post about it at https://medium.com/yandex/yandexs-high-performance-profiler-.... Inspired by Google-Wide Profiling, we started continuous profiling…
More life & fun this month
the category →
A free city-building game in your browser. You are the mayor. You know what the city needs. Now get it past the zoning board, the neighbors, the appeals court and the next election.
Life & fun · 2d ago · permit.petercai.com
- IV
Life & fun · 14d ago · tanzaniaeducationproject.org

Turn a phone, tablet or TV into a sign. Type a message and it fills the screen: welcome signs, timers, Wi-Fi passwords and more. No app, no account, free.
Life & fun · 15d ago · bigwords.page

Play a free virtual guitar online with your keyboard or by touch. Slow songs down and see every chord, string and strum. Acoustic, classic, electric and bass.
Life & fun · 9d ago · guitoro.com

Carrier settings from iPhone, Pixel and Galaxy firmware, decoded and compared: APNs, VoLTE, 5G and Wi-Fi Calling per carrier, and what each build changed.
Life & fun · 13d ago · carrierexplode.com

Life & fun · 23d ago · space.bl2.net
Source: Show HN post ↗
Launched alongside, November 2015
the whole month →

Life & fun · 2015 · dn.ht
- PA
Parinfer - simpler Lisp editing
Life & fun · 2015 · shaunlebron.github.io
 f.lux for iOS▲596
Auto adjust your iOS display based on the time of day
Dev tools · 2015 · justgetflux.com