ExitLens
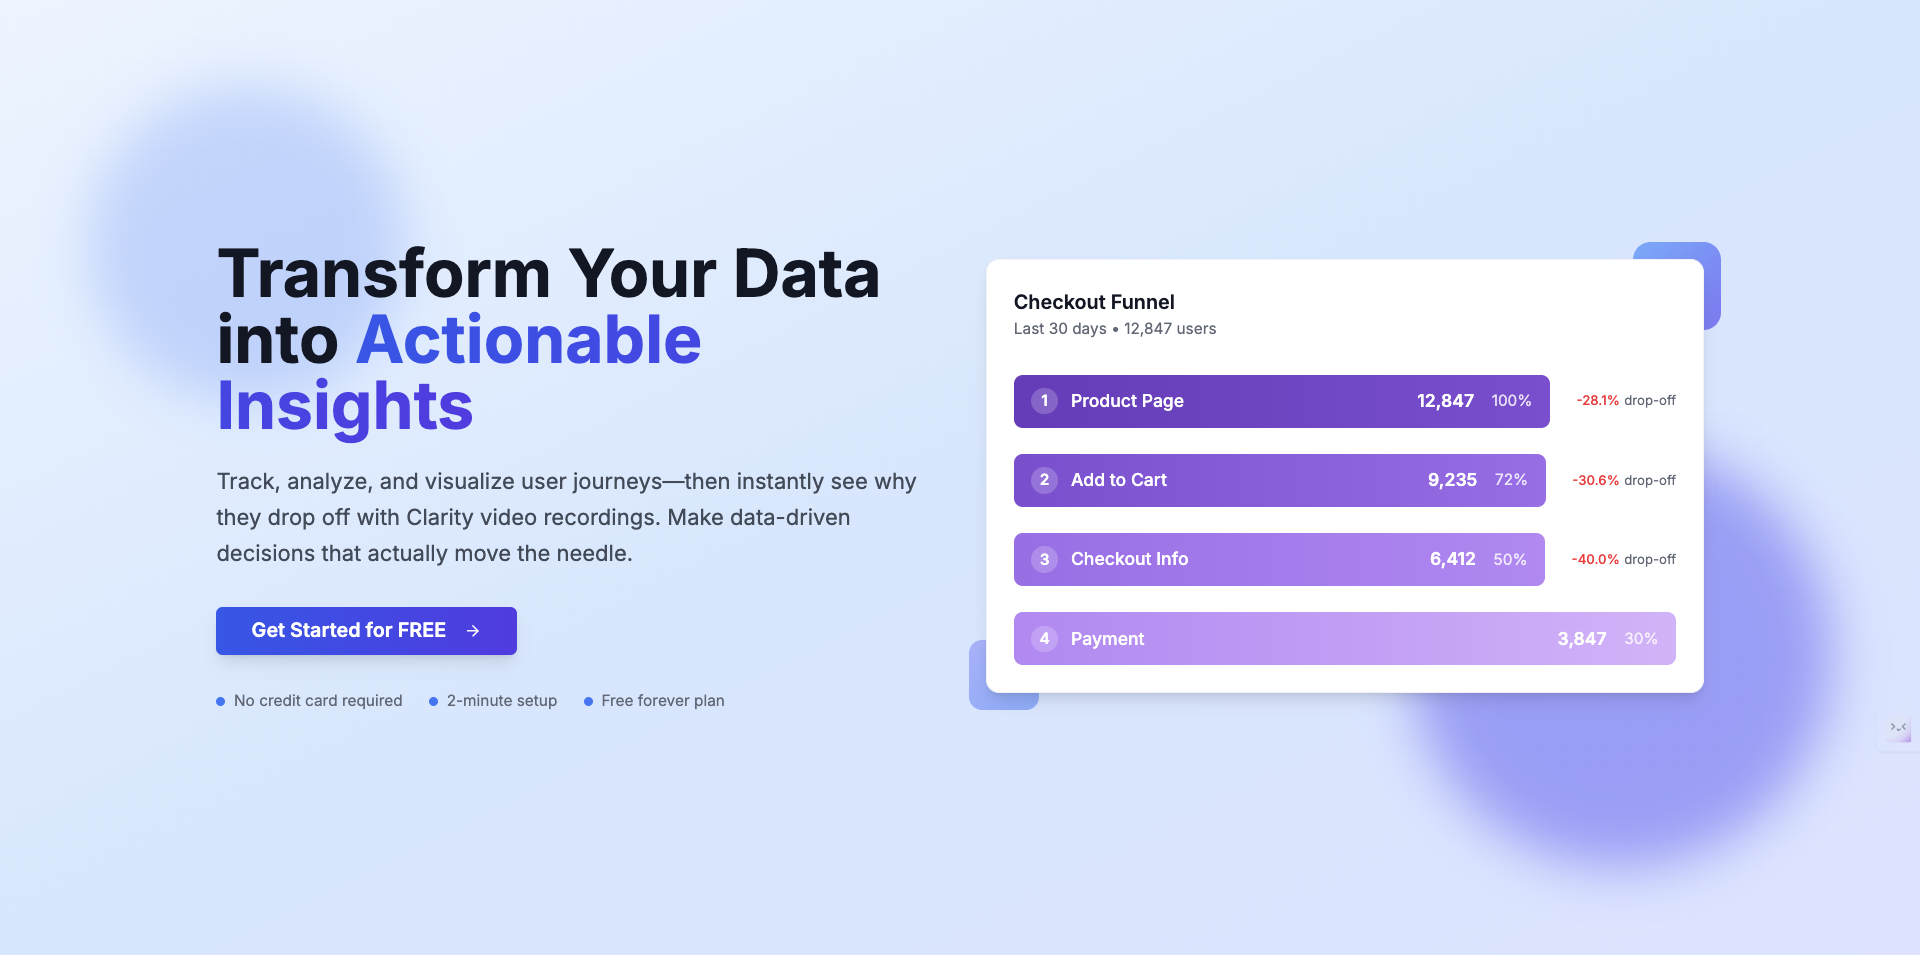
Transform your data into actionable insights
ExitLens launched on June 8, 2025 with 11 votes, #2,422 of 7,999 launches that month and more than 50% of that year's launches.
What it does
Track, analyze, and visualize user journeys with powerful funnel analytics and Clarity video recordings. Make data-driven decisions that move the needle.
Does a similar job
all alternatives → MyLens for ChromeDec 2025 · chromewebstore.google.com · ▲254
Your AI visualization partner, right in your browser.

 ROAARRRNov 2025 · roaarrr.app · ▲182
Hey HN, I built ROAARRR because most analytics tools make it hard to get clear answers. You spend hours setting up dashboards and connecting data, but you still don’t really know what drives growth. ROAARRR brings your key data together and shows your funnel from awareness to revenue. You can track product activity, create charts for specific events, and see how changes affect retention and revenue. It’s free to try today. I’d love your feedback, especially on what feels confusing or missing.


More growth this month
the category →
wallhop is a free paywall bypass. Paste any article link to read it without paywall popups, ads or clutter. No signup, no extension. A simple 12ft.io alternative.
Growth · 12d ago · wallhop.io


Source: Product Hunt launch ↗
Launched alongside, June 2025
the whole month →- IM
Hey HN! Pilots everywhere are required to keep a logbook of all their flying hours, aircraft, airports, and so on. Since I track everything digitally (some people still just use paper logbooks!), I put together some data visualizations and a few 3D globes to show my flying history. This globe is probably my favourite so far: https://jameshard.ing/pilot/globes/all If you’ve got ideas for other graphs or ways to show this kind of data, I’d love to hear them!
Life & fun · 2025 · jameshard.ing

Stunning presentations with AI. No design skills required.
AI · 2025 · chroniclehq.com

Build native mobile apps for iOS and Android without code.
Dev tools · 2025 · bble.io


All your connections, across all your socials.
AI · 2025 · pally.com

I was the main contributor to workout.lol, an open-source fitness app to easily build a workout routine. The project had traction (1.4k GitHub stars, 95 forks, ~20K visits/month), but was eventually sold due to video licensing hurdles. The new owner stopped maintaining it, and the repo went abandoned. Over the next 9 months, I sent 15 emails to try to save it : no replies. Feature requests & issues were ignored. The community was left with a "broken" tool let's say. I couldn't just let it die So I built the new version from scratch with the same open-source spirit, but a better…
Dev tools · 2025 · github.com