
FactoryKPI
Manufacturing dashboard
FactoryKPI launched on June 24, 2025 with 8 votes, #3,354 of 7,999 launches that month and more than 50% of that year's launches. The site was still online in September 2026, 1 year on.
What it does
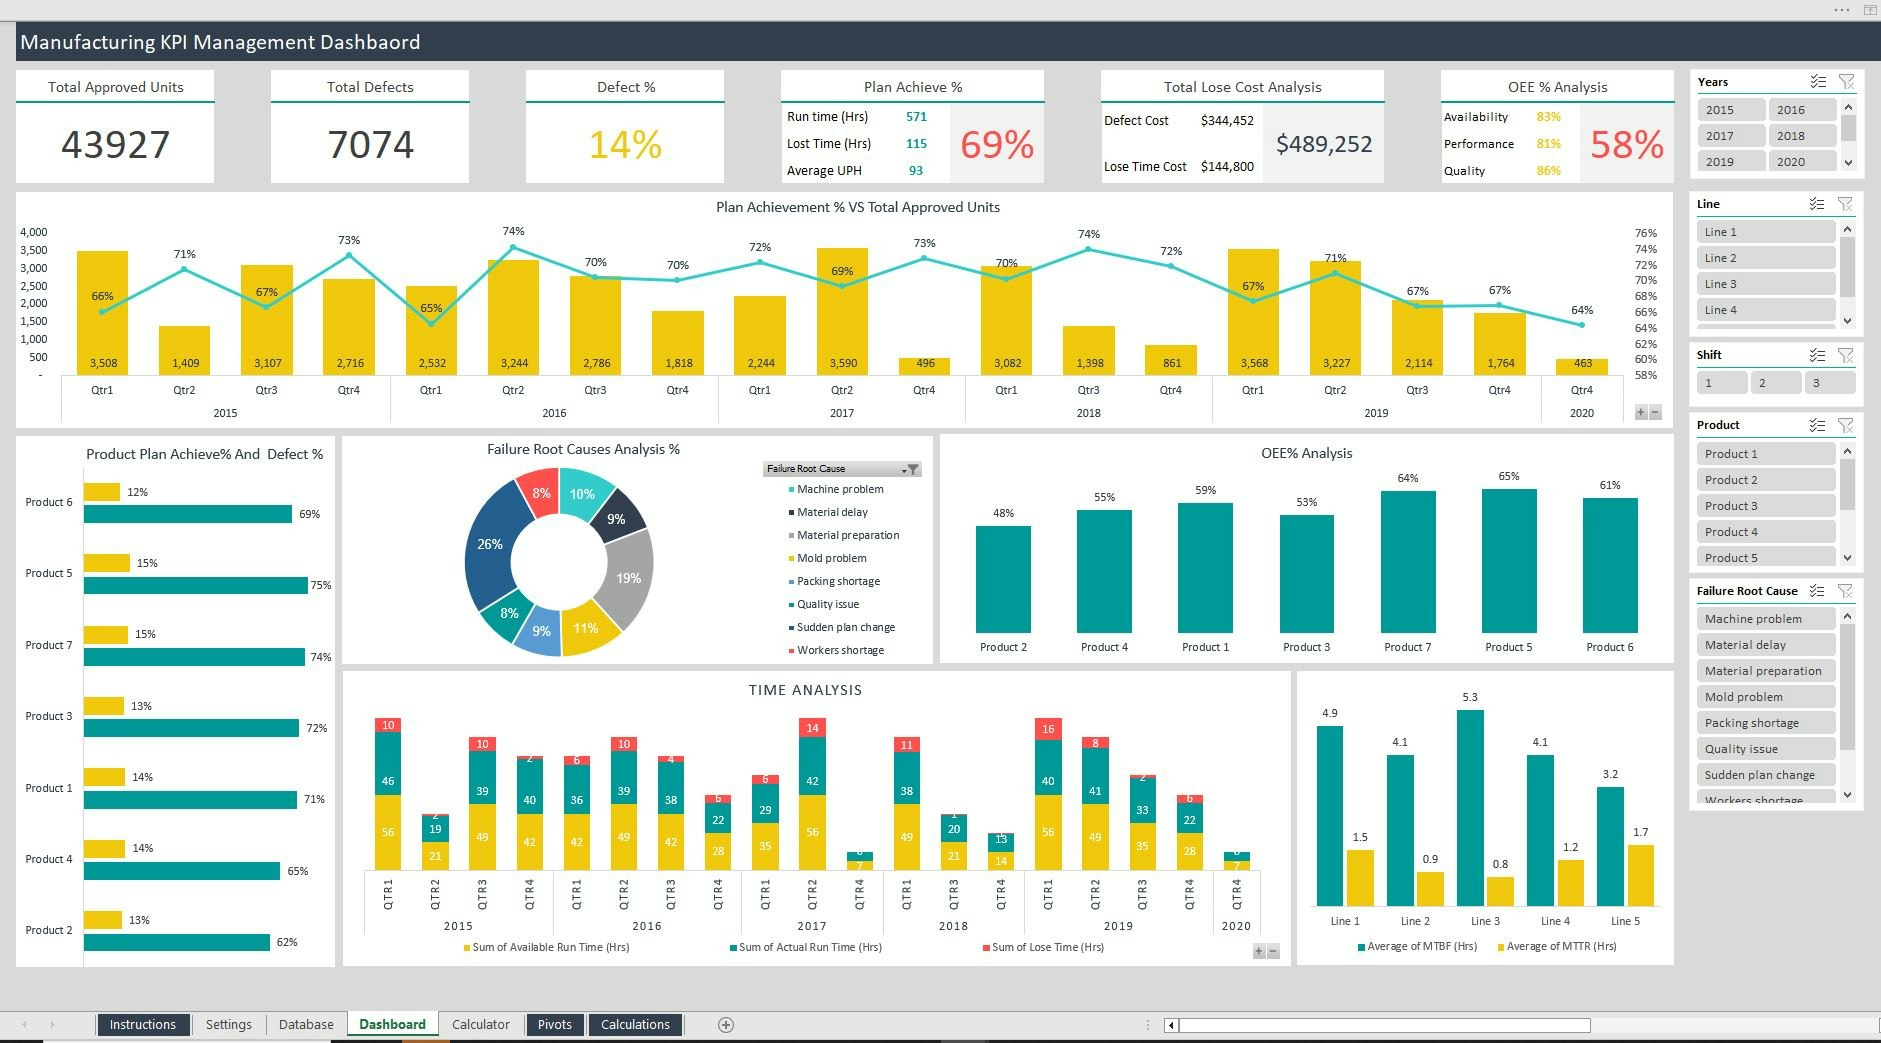
Track the daily performance of your plant for Safety, Quality, Delivery and other kpi's. Provide your Shop Floor Teams with a visual for Continuous Improvement along with daily operations.
FactoryKPI SQDC turns operations data and shop-floor effort into manufacturing performance. A daily improvement dashboard for SQDCME, with optional AI.
FactoryKPI SQDC by ORCALEAN is a fully integrated CI system for Safety, Quality, Delivery, Cost, Morale and Environment KPIs — offering strategic improvement and control for manufacturing operations. For plant and continuous-improvement leaders driving sustained SQDCME performance. FactoryKPI SQDC gives plant managers, operations leaders and shop-floor teams a clear, shared view of daily performance. It helps the organization identify which KPIs need attention, focus on the highest-priority issues, and maintain the operational discipline required to solve problems and sustain improvement. Safety, quality, delivery, cost, morale and environment in one board — current, not…from orcalean.com
Does a similar job
all alternatives →
 DailyKPI2025 · lovable-kpi-dashboard-70.lovable.app · ▲12
Solo entrepreneur KPI dashboard for revenue tracking growth
 Notion Work Journal2021 · prototion.com · ▲131
Dashboard to meet all your targets and optimize time usage
 Analytics & Reports by Screenful2022 · screenful.com · ▲105
Turn your task management data into business KPIs
More growth this month
the category →
wallhop is a free paywall bypass. Paste any article link to read it without paywall popups, ads or clutter. No signup, no extension. A simple 12ft.io alternative.
Growth · 11d ago · wallhop.io


Source: Product Hunt launch ↗
Launched alongside, June 2025
the whole month →- IM
Hey HN! Pilots everywhere are required to keep a logbook of all their flying hours, aircraft, airports, and so on. Since I track everything digitally (some people still just use paper logbooks!), I put together some data visualizations and a few 3D globes to show my flying history. This globe is probably my favourite so far: https://jameshard.ing/pilot/globes/all If you’ve got ideas for other graphs or ways to show this kind of data, I’d love to hear them!
Life & fun · 2025 · jameshard.ing

Stunning presentations with AI. No design skills required.
AI · 2025 · chroniclehq.com

Build native mobile apps for iOS and Android without code.
Dev tools · 2025 · bble.io


All your connections, across all your socials.
AI · 2025 · pally.com

I was the main contributor to workout.lol, an open-source fitness app to easily build a workout routine. The project had traction (1.4k GitHub stars, 95 forks, ~20K visits/month), but was eventually sold due to video licensing hurdles. The new owner stopped maintaining it, and the repo went abandoned. Over the next 9 months, I sent 15 emails to try to save it : no replies. Feature requests & issues were ignored. The community was left with a "broken" tool let's say. I couldn't just let it die So I built the new version from scratch with the same open-source spirit, but a better…
Dev tools · 2025 · github.com