Multithreading + D3 = Fast Reports
We invested a lot of time hacking around with the Google Analytics API and D3 to build a responsive custom reporting engine that can render up to 20 charts and graphs on a single page in just a few seconds. Just released a product based on our technology. Looking for feedback. Check out Megalytic. http://megalytic.com
Multithreading + D3 = Fast Reports launched on December 19, 2013 with 7 votes and more than 50% of that year's launches.
Does a similar job
all alternatives → Rendering One Million Datapoints with D3 and WebGL2020 · blog.scottlogic.com · ▲200
Over the weekend I was discussing the latest news relating to open weights with some of my non-techie friends. After 30 mins of waffling, I realised it is quite a long and interesting story, with many twists and turns. I've always wanted to create a 'long scroll' story, but have never found a suitable story to tell. This felt like a fun weekend project to undertake. The story itself doesn't have too many scroll effects (which is probably a good thing), it was more about trying to tell a story with a certain style that wouldn't really fit on my personal blog. Would love to get your feedback…
- P3Plotting 3 years of hourly data in 150ms2020 · leeoniya.github.io · ▲785

 A gallery of graphs built with React and D3.js2023 · react-graph-gallery.com · ▲297
Many JS libraries exist to build graphs on the web (Vega, chartJS, Plotly...). They allow to make charts quickly. But you lose flexibility: you're limited by the options they offer. I just created a gallery with hundreds of graphs made with d3.js and React. - Examples are split by graph types - They all come with explanation and code sandboxes - Gradual complexity to ease the learning curve It took me ages to create this project! Feedback welcome!
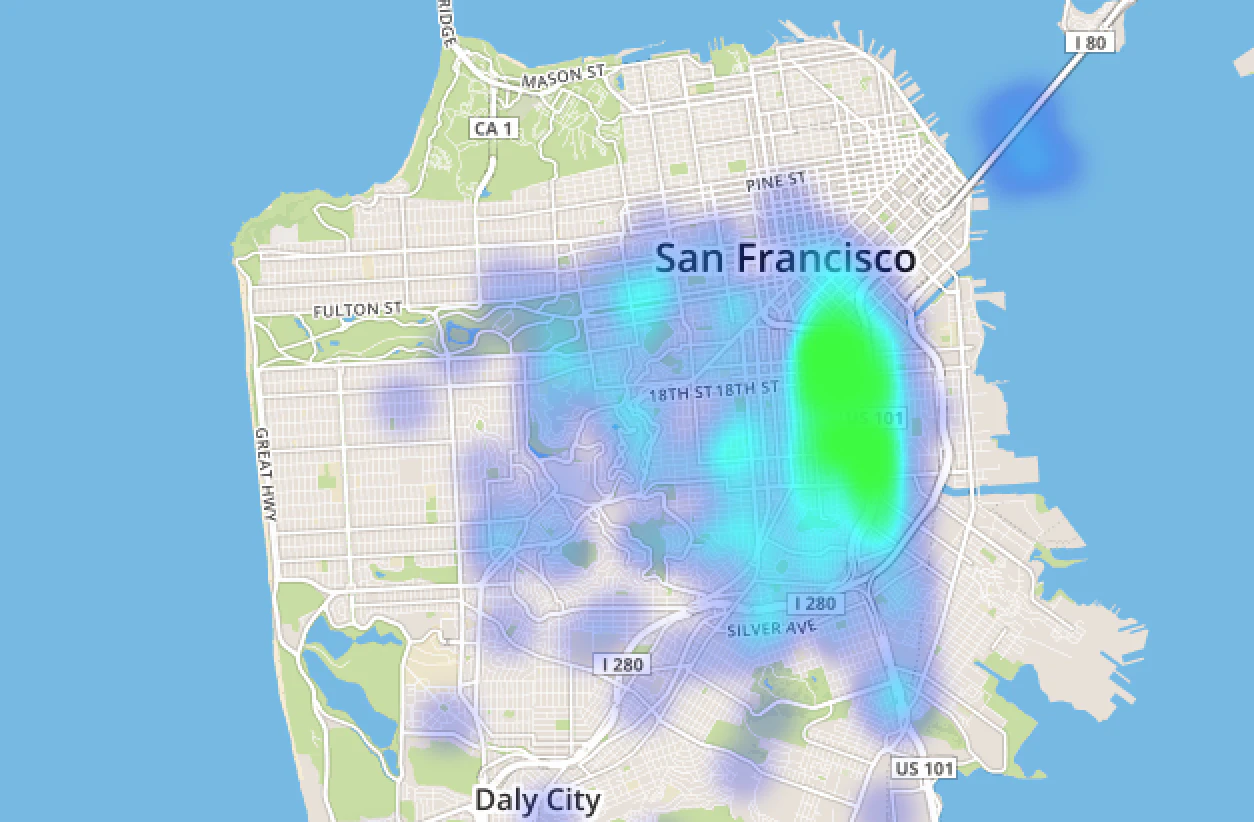
- GRGitHub Repo Visualizer Using D32024 · see-my-repo.netlify.app · ▲76
I built this as part of my quest to properly learn data visualization. The code is the easy part! Some lessons learned: - personal verification of the the general truth that pie charts are tough! and the returns are not great for the effort due to people's difficulties perceiving angles - may not use "vanilla" d3 with no React. was difficult to adapt for mobile - the GitHub API provides fairly standardized responses so building dynamic charts wasn't too bad. But when working with streaming data (say Kafka) I can see this getting interesting... schema registry should help but creating a view…
More dev tools this month
the category →

open-source IDE for thoughtful software design. Contribute to devdotfast/whiteboard development by creating an account on GitHub.
Dev tools · 29d ago · github.com

Contribute to reladraw/reladraw development by creating an account on GitHub.
Dev tools · 27d ago · github.com

Contribute to oosexgang/hackios-xnu-kernel development by creating an account on GitHub.
Dev tools · 14h ago · github.com
 OpenBot▲362
Grok Bot alternative: free, local, open-source, multiplayer
Dev tools · 24d ago · openbot.run
 Talanoa▲346
Hi HN, I’m a fullstack developer, and honestly, I’ve lost count of how many side projects I’ve worked on over the years. But one idea kept coming back to me: a different kind of email client. It first came to me in 2014: “What if we could handle emails more like conversations?” Every year, I’d revisit this concept in my “Build Notes.” Ten years later, no one had built exactly what I had in mind — so I finally decided to do it myself. That’s how Talanoa was born. I wanted something focused on people, not timelines. I was tired of marking messages as unread just to remember to reply later, or…
Dev tools · 21d ago · talanoa.email
Source: Show HN post ↗
Launched alongside, December 2013
the whole month →

- IM
Life & fun · 2013 · bestmedicareprice.com


- IM
Life & fun · 2013 · boredbanker.com