NYC Taxi Visualization
NYC Taxi Visualization launched on March 31, 2016 with 6 votes and more than 50% of that year's launches. The site was still online in September 2026, 10 years on.
What it does
Click on the map to see the most common destinations for trips originating from that point. The histogram below shows trip frequency by hour of the day for all trips leaving the origin. Hover for details. Powered by open data found here . Over 77 million taxi trips from January to June 2015. The data was aggregated using Python scripts and stored in flat files for easy and rapid access. The UI is built with Leaflet, d3, jQuery and Bootstrap. The code can be found on GitHubfrom michaelfogleman.com
Does a similar job
all alternatives →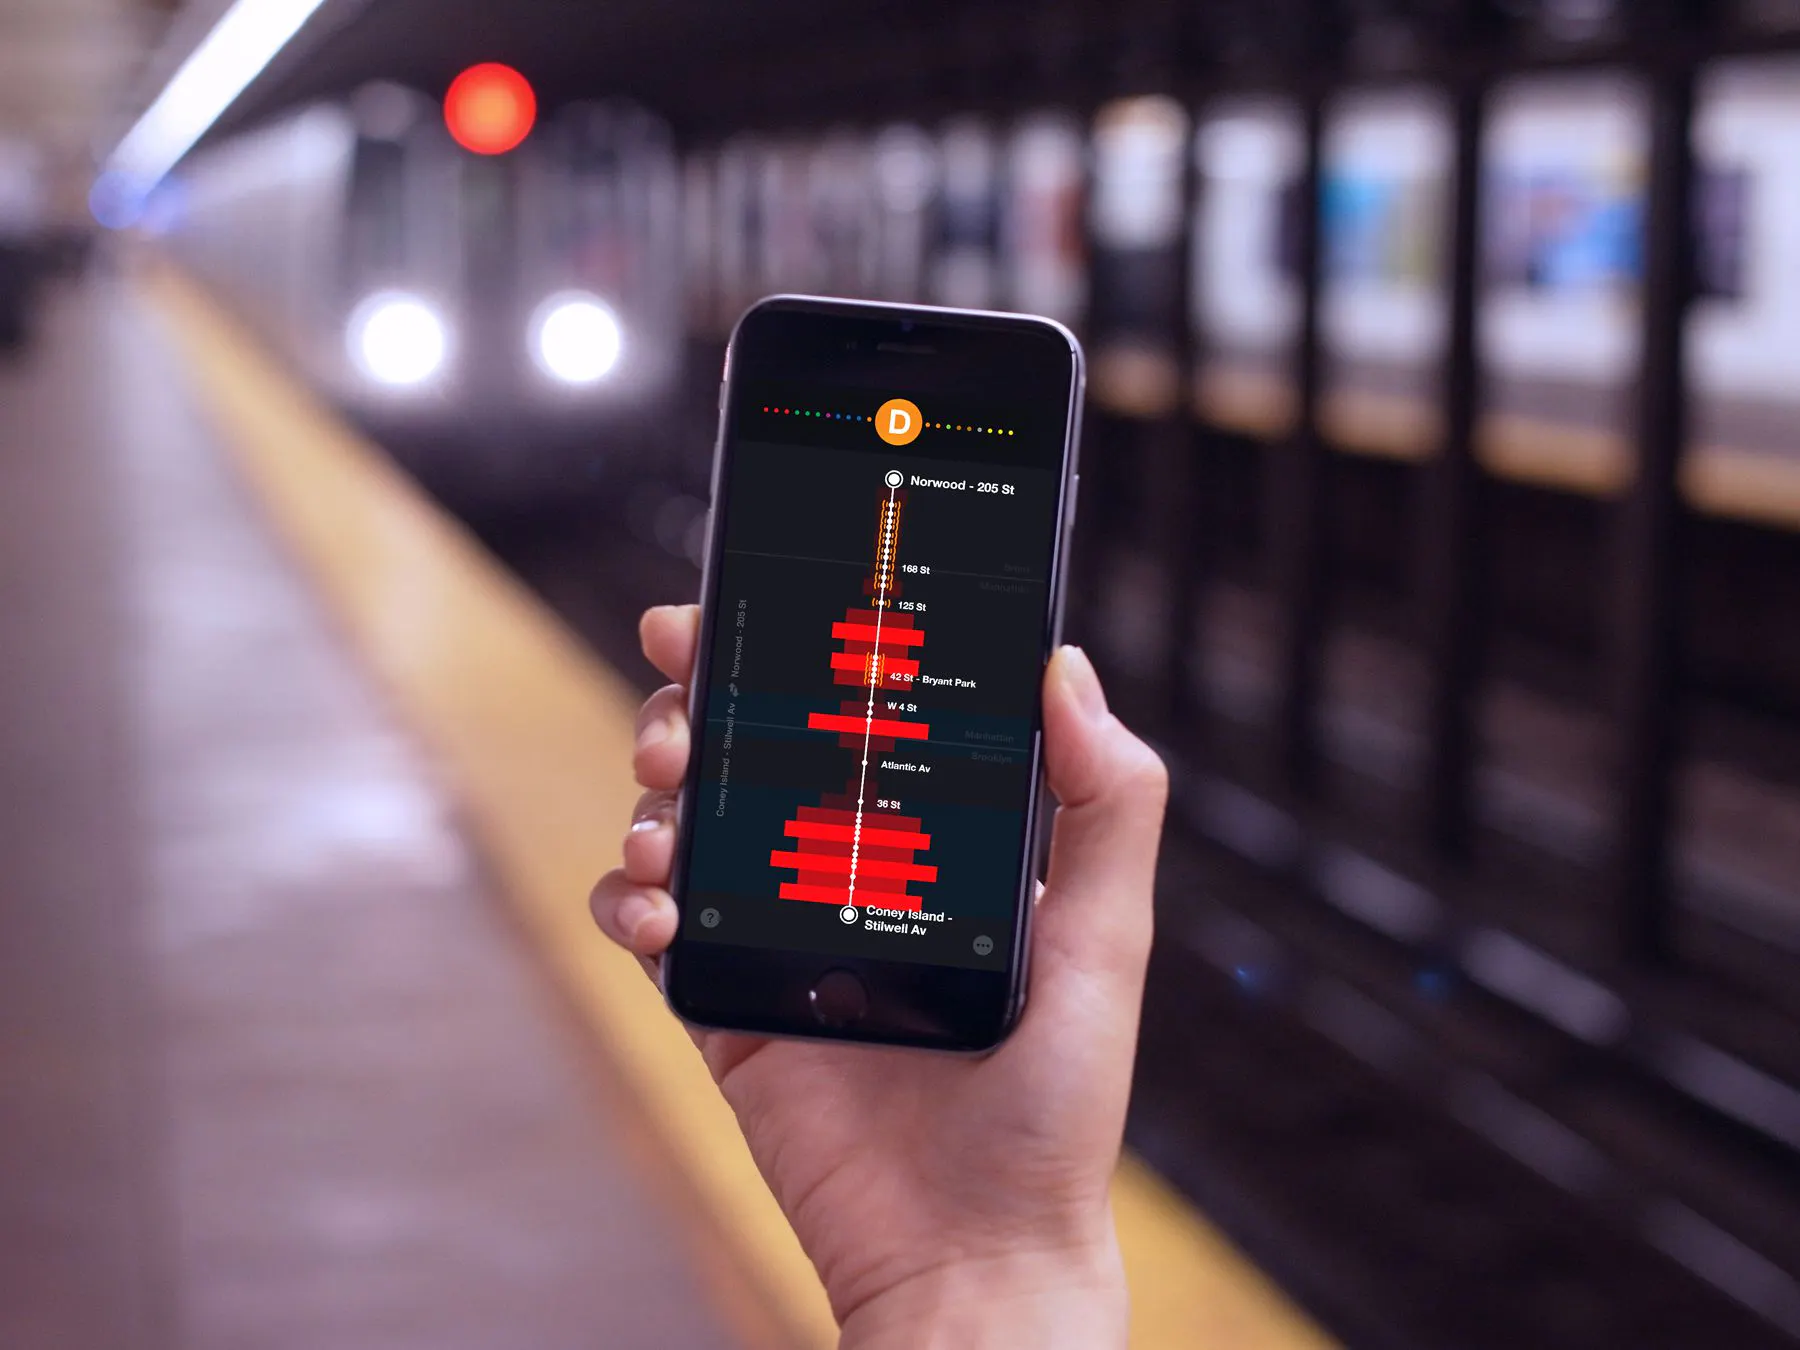
- AIAn interactive visualization of Switzerland's public transport network2019 · tempusfugit.ch · ▲6

 Live Uber Fare Map2015 · uberestimate.com · ▲9

More life & fun this month
the category →
A free city-building game in your browser. You are the mayor. You know what the city needs. Now get it past the zoning board, the neighbors, the appeals court and the next election.
Life & fun · 2d ago · permit.petercai.com
- IV
Life & fun · 14d ago · tanzaniaeducationproject.org

Turn a phone, tablet or TV into a sign. Type a message and it fills the screen: welcome signs, timers, Wi-Fi passwords and more. No app, no account, free.
Life & fun · 15d ago · bigwords.page

Play a free virtual guitar online with your keyboard or by touch. Slow songs down and see every chord, string and strum. Acoustic, classic, electric and bass.
Life & fun · 9d ago · guitoro.com

Carrier settings from iPhone, Pixel and Galaxy firmware, decoded and compared: APNs, VoLTE, 5G and Wi-Fi Calling per carrier, and what each build changed.
Life & fun · 13d ago · carrierexplode.com

Life & fun · 23d ago · space.bl2.net
Source: Show HN post ↗
Launched alongside, March 2016
the whole month →

 Franz▲877
Franz combines WhatsApp, Slack, Telegram, Gmail, Outlook, and native Signal in one desktop app with AI summaries, workspaces, and privacy-conscious local features.
Work · 2016 · meetfranz.com


