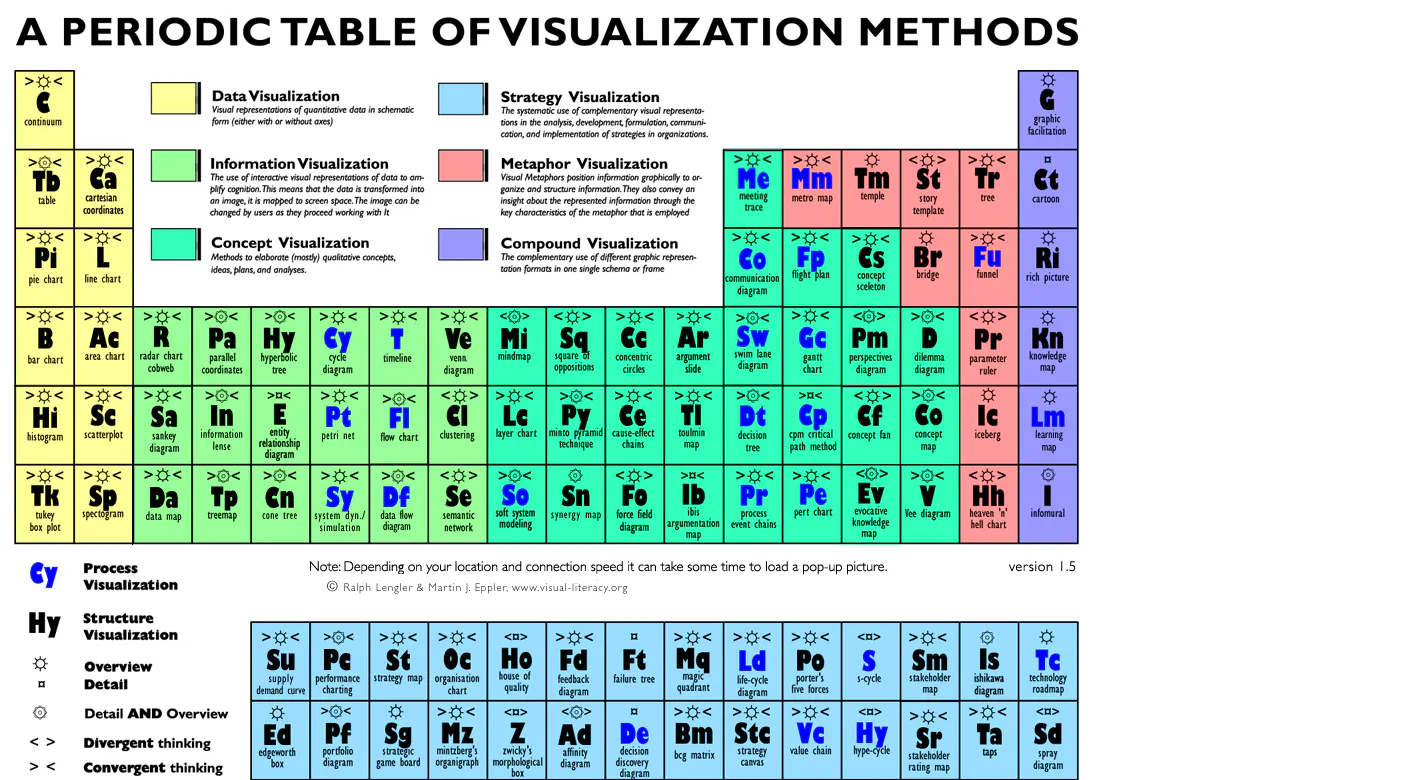
Periodic Table of Visualization Methods
Visualization for communication, engineering and business
Periodic Table of Visualization Methods launched on April 15, 2016 with 2 votes. The site was still online in September 2026, 10 years on.
Does a similar job
all alternatives →


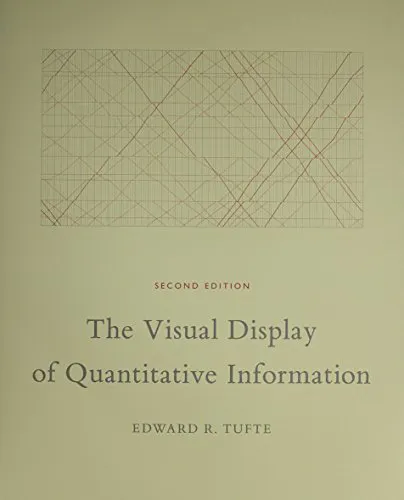 The Visual Display of Quantitative Information2015 · amazon.com · ▲57
The bible for people interested in presenting information

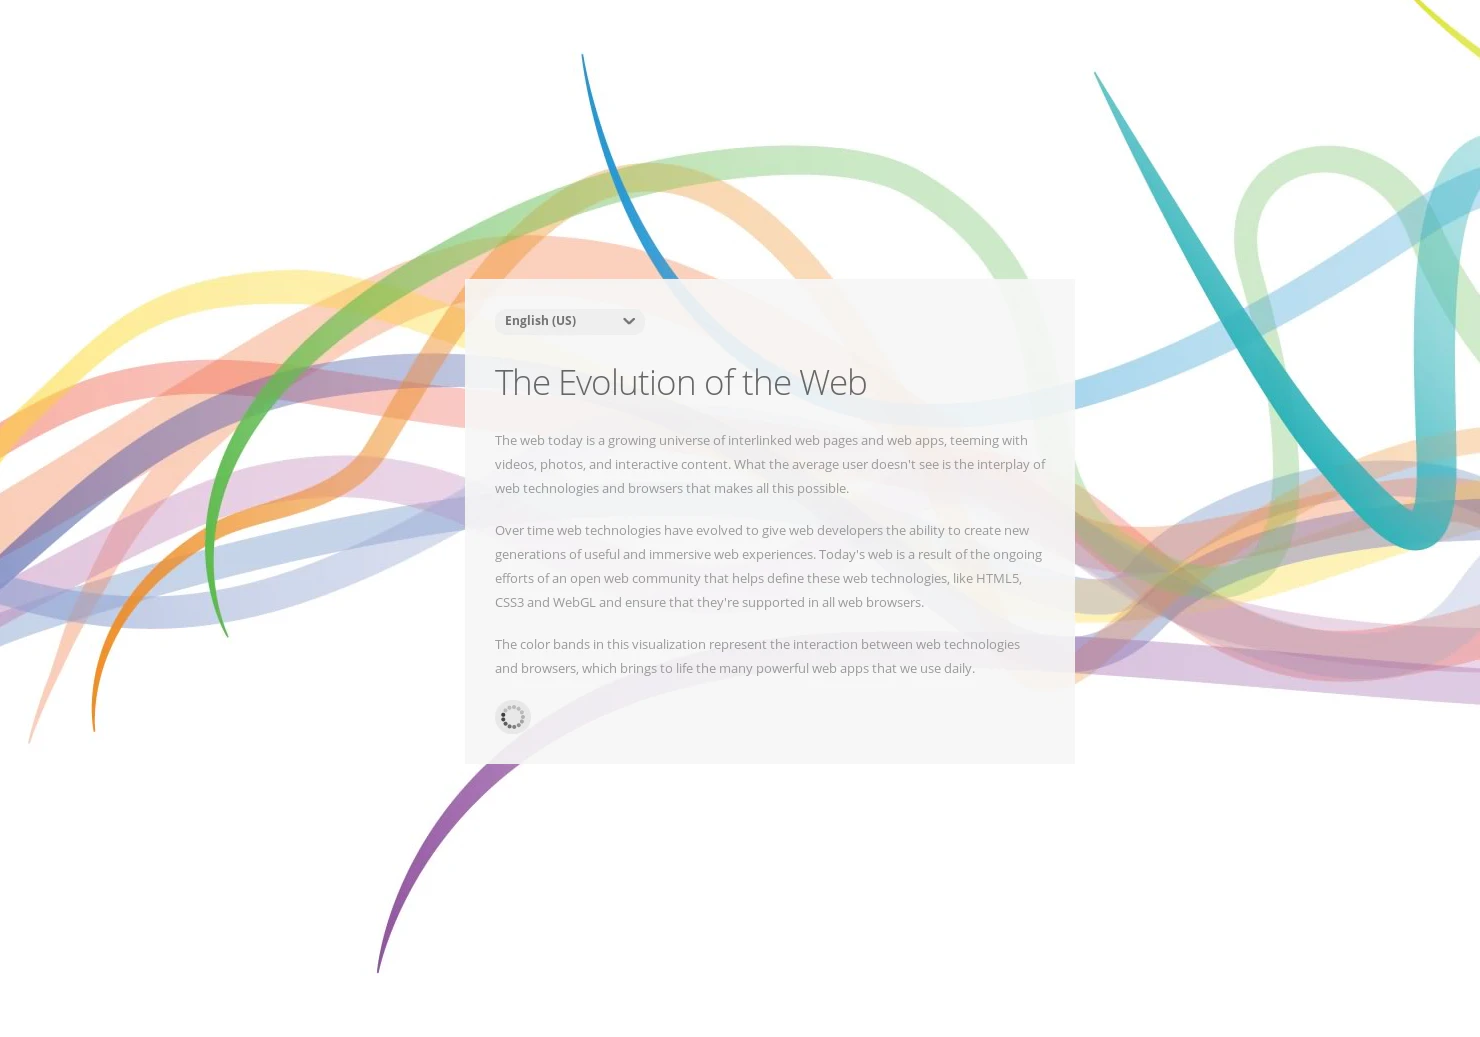 The evolution of the web2015 · evolutionofweb.appspot.com · ▲94
A data visualization about the growth of the web since 1990
More life & fun this month
the category →
A free city-building game in your browser. You are the mayor. You know what the city needs. Now get it past the zoning board, the neighbors, the appeals court and the next election.
Life & fun · 2d ago · permit.petercai.com
- IV
Life & fun · 14d ago · tanzaniaeducationproject.org

Turn a phone, tablet or TV into a sign. Type a message and it fills the screen: welcome signs, timers, Wi-Fi passwords and more. No app, no account, free.
Life & fun · 15d ago · bigwords.page

Play a free virtual guitar online with your keyboard or by touch. Slow songs down and see every chord, string and strum. Acoustic, classic, electric and bass.
Life & fun · 9d ago · guitoro.com

Carrier settings from iPhone, Pixel and Galaxy firmware, decoded and compared: APNs, VoLTE, 5G and Wi-Fi Calling per carrier, and what each build changed.
Life & fun · 13d ago · carrierexplode.com

Life & fun · 23d ago · space.bl2.net
Source: Product Hunt launch ↗
Launched alongside, April 2016
the whole month →


Access all the files on Dropbox without having to sync
Work · 2016 · blog.dropbox.com

The easiest way to build an FB bot. No coding required!
Dev tools · 2016

Quickly find your Bootstrap classes on this interactive Bootstrap cheat sheet. It includes code samples and live preview of elements.
Dev tools · 2016 · hackerthemes.com