React+D3.js, an ebook that teaches you dataviz with React
This quick eBook will teach you how to make React and d3.js play together in less than an hour.
React+D3.js, an ebook that teaches you dataviz with React launched on March 16, 2015 with 19 votes, #1,137 of 2,697 launches that month and more than 75% of that year's launches. The site was still online in September 2026, 11 years on.
In plain words
React+D3.js is an ebook that teaches developers how to integrate React and d3.js for data visualization. The guide covers creating composable, reusable visualization components and explains when this approach suits a project's needs. Designed for developers familiar with modern JavaScript frameworks, it provides practical knowledge in approximately one hour, enabling users to build their own library of visualization parts using both libraries together.
written from the facts on this page · September 2026
From the sources
After an hour with React+d3.js, you’ll know how to make React and d3.js play together. You’ll know how to create composable data visualizations. You’re going to understand *why* that’s a good idea, and you will have the tools to build your own library of re-usable visualization parts. Ultimately, you’re going to understand whether React and d3.js fit the needs of your project. React is Facebook's and Instagram's approach to writing modern JavaScript front-ends. It encourages building an app out of small re-usable components. Each is self-contained and only needs to know how to render a small bit of the interface. But many frameworks have attempted this. Everything from Angular to Backbone…from leanpub.com
Does a similar job
all alternatives → A gallery of graphs built with React and D3.js2023 · react-graph-gallery.com · ▲297
Many JS libraries exist to build graphs on the web (Vega, chartJS, Plotly...). They allow to make charts quickly. But you lose flexibility: you're limited by the options they offer. I just created a gallery with hundreds of graphs made with d3.js and React. - Examples are split by graph types - They all come with explanation and code sandboxes - Gradual complexity to ease the learning curve It took me ages to create this project! Feedback welcome!


 Build your first real world React.js application2016 · academy.plot.ly · ▲261
How to use the Plotly.js React component.
 React+D3.js, learn how to build visualizations with React2015 · swizec.com · ▲6
Learn how to build scalable dataviz components your whole team can understand with React for Data Visualization.
 Learn React fundamentals2019 · github.com · ▲509
Application that will help you learn React fundamentals. Install this application locally - there's tutorial, code snippets and exercises. The main objective of this project is to help you get off the ground with React! - tyroprogrammer/learn-react-app
More life & fun this month
the category →
A free city-building game in your browser. You are the mayor. You know what the city needs. Now get it past the zoning board, the neighbors, the appeals court and the next election.
Life & fun · 1d ago · permit.petercai.com
- IV
Life & fun · 13d ago · tanzaniaeducationproject.org

Turn a phone, tablet or TV into a sign. Type a message and it fills the screen: welcome signs, timers, Wi-Fi passwords and more. No app, no account, free.
Life & fun · 14d ago · bigwords.page

Play a free virtual guitar online with your keyboard or by touch. Slow songs down and see every chord, string and strum. Acoustic, classic, electric and bass.
Life & fun · 8d ago · guitoro.com

Carrier settings from iPhone, Pixel and Galaxy firmware, decoded and compared: APNs, VoLTE, 5G and Wi-Fi Calling per carrier, and what each build changed.
Life & fun · 12d ago · carrierexplode.com

Life & fun · 22d ago · space.bl2.net
Source: Show HN post ↗
Launched alongside, March 2015
the whole month →

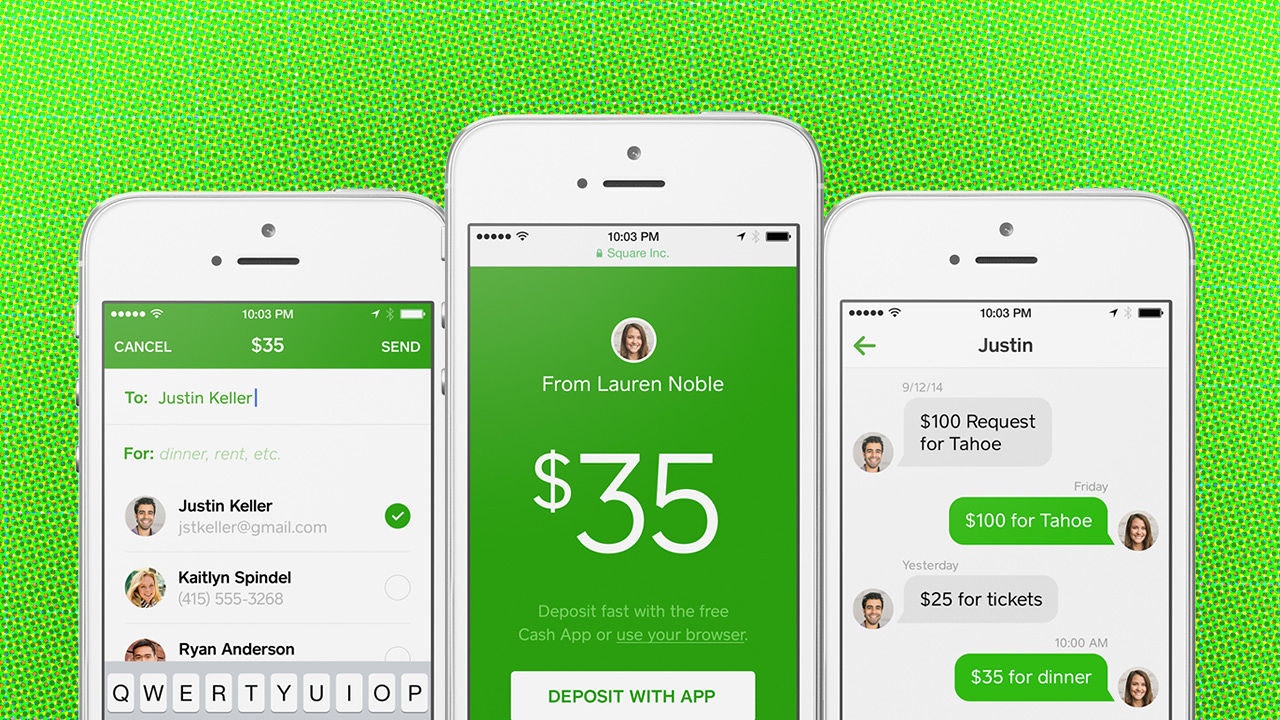
Get paid via $cashtags for things you do online or in person
Commerce · 2015 · t.co