Life & fun · February 23, 2016
Spatial data analysis and visualization in Excel
Spatial data analysis and visualization in Excel launched on February 23, 2016 with 19 votes, #1,911 of 4,386 launches that month and more than 75% of that year's launches. The site was still online in September 2026, 10 years on.
In plain words
GIS.XL is an Excel add-in that combines spreadsheet functionality with spatial data analysis and visualization capabilities. It allows users to work with geographic information systems tools directly within Excel, eliminating the need to transfer data between separate applications. The add-in is designed for those who need to analyze and visualize spatial data while maintaining the familiarity and simplicity of Excel's interface.
written from the facts on this page · September 2026
From the sources
GIS.XL is an Excel add-in for work with spatial data. With this add-in you can combine features of Excel spreadsheets with specialized applications for spatial data analysis and visualization (GIS). Simplicity of Excel & power of GIS inside one window. See also our new Reshape.XL add-in. Data processing in Excel has never been so easy and fast... Reduce the complexity of work with spatial data. With the GIS.XL add-in you can use in one environment features of classic spreadsheet interface and selected features of professional GIS applications. No time-consuming data transfer between spreadsheet and maps. Visualize and analyse your spatial data in few clicks. Carefully selected important…from gisxl.com
Does a similar job
all alternatives →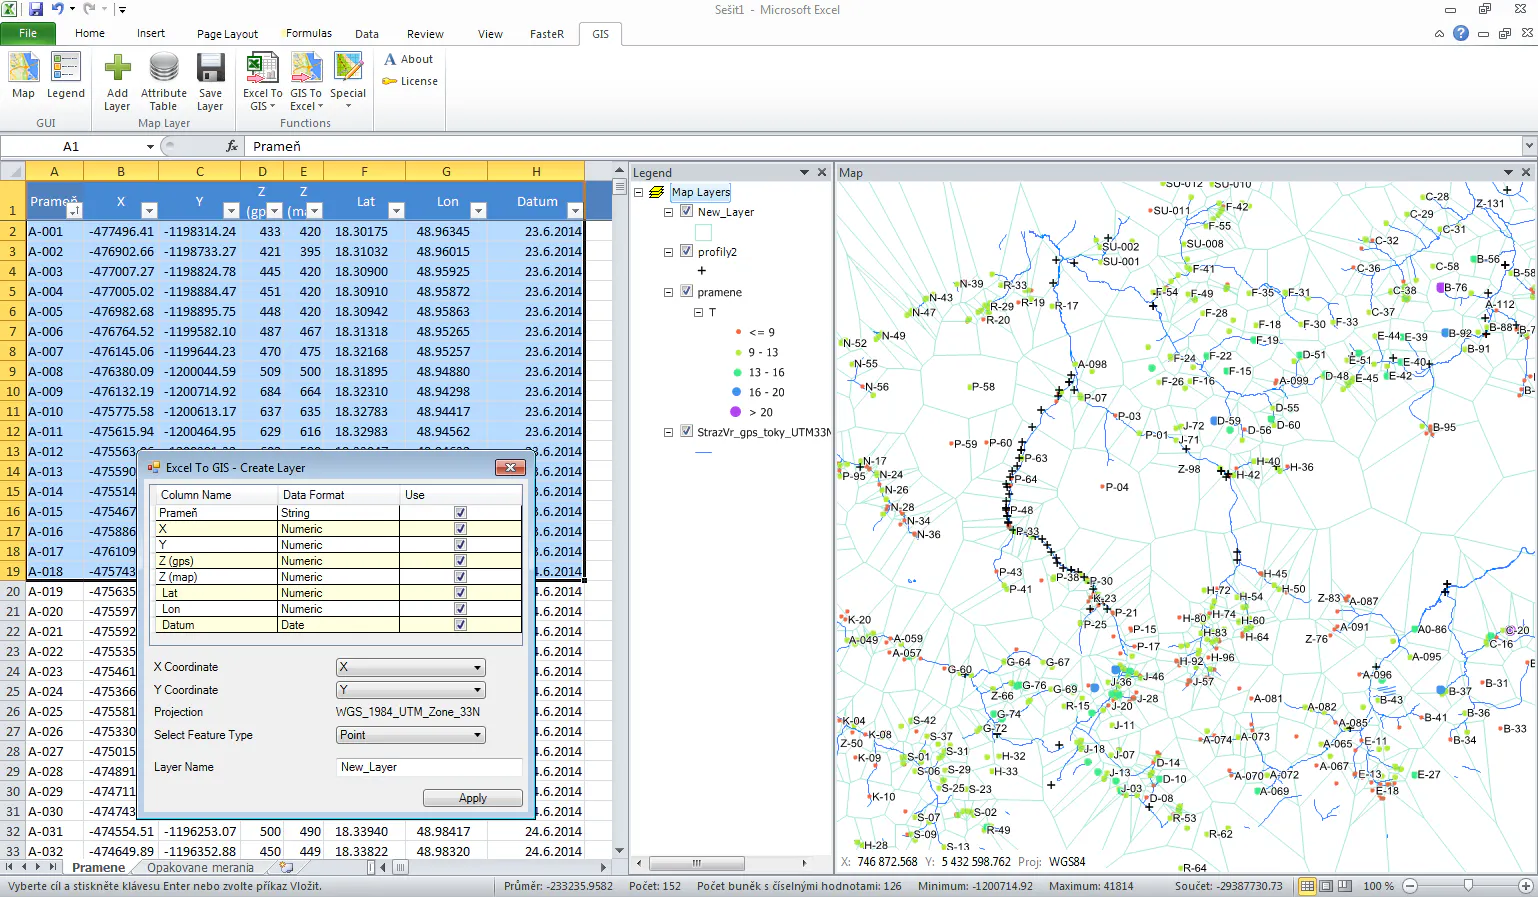

- HIHadoop in Excel2013 · datanitro.com · ▲82

 Gio.js – 3D Globe Data Visualization Library Built with Three.js2018 · github.com · ▲18
🌏 A Declarative 3D Globe Data Visualization Library built with Three.js - syt123450/giojs

More life & fun this month
the category →
A free city-building game in your browser. You are the mayor. You know what the city needs. Now get it past the zoning board, the neighbors, the appeals court and the next election.
Life & fun · 2d ago · permit.petercai.com
- IV
Life & fun · 14d ago · tanzaniaeducationproject.org

Turn a phone, tablet or TV into a sign. Type a message and it fills the screen: welcome signs, timers, Wi-Fi passwords and more. No app, no account, free.
Life & fun · 15d ago · bigwords.page

Play a free virtual guitar online with your keyboard or by touch. Slow songs down and see every chord, string and strum. Acoustic, classic, electric and bass.
Life & fun · 9d ago · guitoro.com

Carrier settings from iPhone, Pixel and Galaxy firmware, decoded and compared: APNs, VoLTE, 5G and Wi-Fi Calling per carrier, and what each build changed.
Life & fun · 13d ago · carrierexplode.com

Life & fun · 23d ago · space.bl2.net
Source: Show HN post ↗
Launched alongside, February 2016
the whole month →
A new way to start an internet business anywhere
Dev tools · 2016 · stripe.com


:memo: Today I Learned. Contribute to jbranchaud/til development by creating an account on GitHub.
Dev tools · 2016 · github.com


- H2
Life & fun · 2016 · hisham.hm