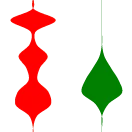
Stacked Candle
See the Volume!
Stacked Candle launched on November 22, 2019 with 2 votes.
What it does
18th Century... merchant Homma makes candlestick chart. We have used his chart ever since - He should be proud! Problem: no volume, only indicates price history. Stacked Candles grow wider in proportion to trading volume. See the volume at each price!
Does a similar job
all alternatives → Inflation-adjusted stock charts – Total Real Returns2022 · totalrealreturns.com · ▲507
Here's a little side project I’ve been working on: https://totalrealreturns.com/ The Total Real Returns chart demonstrates the preservation or growth of real wealth more clearly than conventional (nominal-dollar, price-only) stock charts, because: (1) we include the effects of inflation-diminished purchasing power, and (2) we include the effects of reinvesting dividends from the initial investment. I found it harder to explain the y-axis in words than it was to do the math, so please let me know if you think the "baguettes" explanation on the homepage helps. I was up until 4am…


 Kandle - Chart InsightsDec 2025 · play.google.com · ▲11
Technical analysis from a chart image—nothing else needed.


More work this month
the category →
 Smooth Recorder▲257
Mac screen recordings that look edited when you hit stop
Work · 25d ago · smoothrecorder.com


Work · 19d ago · readrare.com
Source: Product Hunt launch ↗


