Life & fun · November 27, 2021
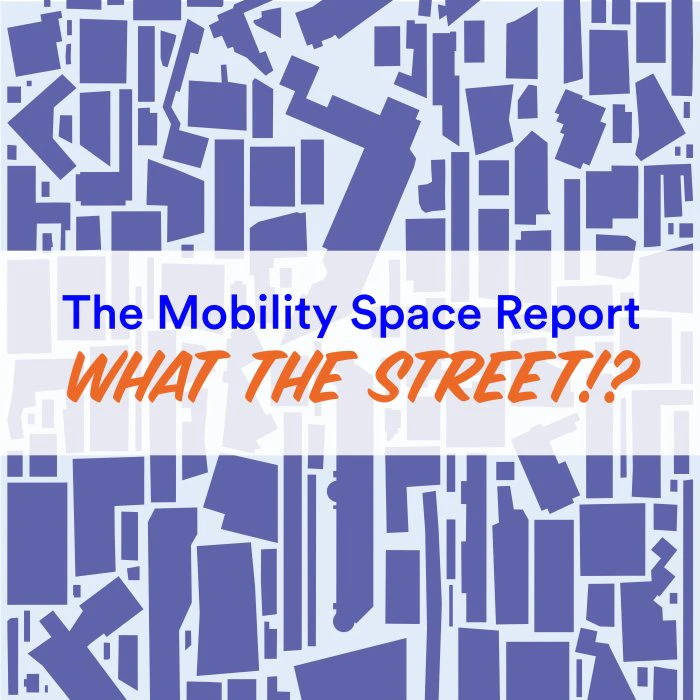
Visualizing bikeshare in the United States
Visualizing bikeshare in the United States launched on November 27, 2021 with 5 votes and more than 50% of that year's launches. The site was not reachable when checked in September 2026.
Does a similar job
all alternatives → I visualized the entire history of Citi Bike in the browserJan 2026 · bikemap.nyc · ▲113
Each moving arrow represents one real bike ride out of 291 million, and if you've ever taken a Citi Bike before, you are included in this massive visualization! You can search for your ride using Cmd + K and your Citi Bike receipt, which should give you the time of your ride and start/end station. Everything is open source: https://github.com/freemanjiang/bikemap Some technical details: - No backend! Processed data is stored in parquet files on a Cloudflare CDN, and queried directly by DuckDB WASM - deck.gl w/ Mapbox for GPU-accelerated rendering of thousands of…




More life & fun this month
the category →
A free city-building game in your browser. You are the mayor. You know what the city needs. Now get it past the zoning board, the neighbors, the appeals court and the next election.
Life & fun · 3d ago · permit.petercai.com
- IV
Life & fun · 15d ago · tanzaniaeducationproject.org

Turn a phone, tablet or TV into a sign. Type a message and it fills the screen: welcome signs, timers, Wi-Fi passwords and more. No app, no account, free.
Life & fun · 16d ago · bigwords.page

Play a free virtual guitar online with your keyboard or by touch. Slow songs down and see every chord, string and strum. Acoustic, classic, electric and bass.
Life & fun · 9d ago · guitoro.com

Carrier settings from iPhone, Pixel and Galaxy firmware, decoded and compared: APNs, VoLTE, 5G and Wi-Fi Calling per carrier, and what each build changed.
Life & fun · 14d ago · carrierexplode.com

Life & fun · 23d ago · space.bl2.net
Source: Show HN post ↗
Launched alongside, November 2021
the whole month →
- MW
Life & fun · 2021 · nomdebebe.app

Dev tools · 2021 · apps.apple.com

Eligible startups get Intercom features at a 95% discount
Growth · 2021 · intercom.com

Life & fun · 2021 · jacquesmattheij.com
