Life & fun · alternatives · 2026
24 alternatives to Continuous profiling demo with 1 year of data
This is a demonstration of continuous profiling software that stores and displays a year of performance data. Built on Pyroscope, it shows how developers can monitor application performance over extended periods. The… Below are 24 products that do a similar job, ranked by how close each is in meaning and then by launch-day votes. Continuous profiling demo with 1 year of data launched in 2021; newer entries below may have overtaken it.
- 1

2021 · github.com · its alternatives →
- 2

Check out our new project to add some insight into OOM kill events for Go programs. Source code: https://github.com/parca-dev/oomprof/ Description of how it was put together: https://www.polarsignals.com/blog/posts/2025/08/13/oomprof
2021 · polarsignals.com · its alternatives →
- 3

2021 · prodfiler.com · its alternatives →
- 4RT
2012 · dashboard.graphdat.com · its alternatives →
- 5RT
2014 · scoutapp.github.io · its alternatives →
- 6

Sampling profiler for Python programs. Contribute to benfred/py-spy development by creating an account on GitHub.
2018 · github.com · its alternatives →
- 7
 Chronoscope▲117
Automated time tracking for software teams
2024 · chronoinnovation.com · its alternatives →
- 8
- 9
- 10

Hey HN! We are happy to share Perforator – our internal cluster-wide profiler with great support for native languages and a built-in AutoFDO pipeline to simplify sPGO builds. Perforator allows you to profile most binaries without having to recompile or adjust the build process. We use it at Yandex to profile each pod inside a large cluster at modest speed (99Hz), collecting petabytes of profiles every day. There's a blog post about it at https://medium.com/yandex/yandexs-high-performance-profiler-.... Inspired by Google-Wide Profiling, we started continuous profiling…
2025 · github.com · its alternatives →
- 11

allocscope - a memory tracking tool. Contribute to matt-kimball/allocscope development by creating an account on GitHub.
2023 · github.com · its alternatives →
- 12IB
Senior full stack software engineer with 8+ years shipping production systems in React, Node.js, Python, and Rails. Previously a Product Engineer at Ghost. Based in South Korea.
2021 · ronaldlangeveld.com · its alternatives →
- 13

Hi all, I'm excited to announce Stratoshark, a sibling application to Wireshark that lets you capture and analyze process activity (system calls) and log messages in the same way that Wireshark lets you capture and analyze network packets. If you would like to try it out you can download installers for Windows and macOS and source code for all platforms at https://stratoshark.org. AMA: I'm the goofball whose name is at the top of the "About" box in both applications, and I'll be happy to answer any questions you might have.
2025 · stratoshark.org · its alternatives →
- 14

A node asynchronous process and package monitor. Contribute to AsyncOptics/async-optics development by creating an account on GitHub.
2018 · github.com · its alternatives →
- 15RG
- 16RA
2015 · rbkit.codemancers.com · its alternatives →
- 17

Hey HN. We’re Jay and Vadim from Highlight.io (https://highlight.io). We’re building an open source [1] monitoring platform for web applications. Today we’re excited to be sharing a performance tool we’ve been working on, which helps you inspect the latency of code execution from the client to the server. As engineers at past startups, we often had to debug slow queries, poor load times, inconsistent errors, etc... While tools like Jaegar [2] helped us inspect server-side performance, we had no way to tie user events to the traces we were inspecting. In other words, although we had…
2024 · github.com · its alternatives →
- 18
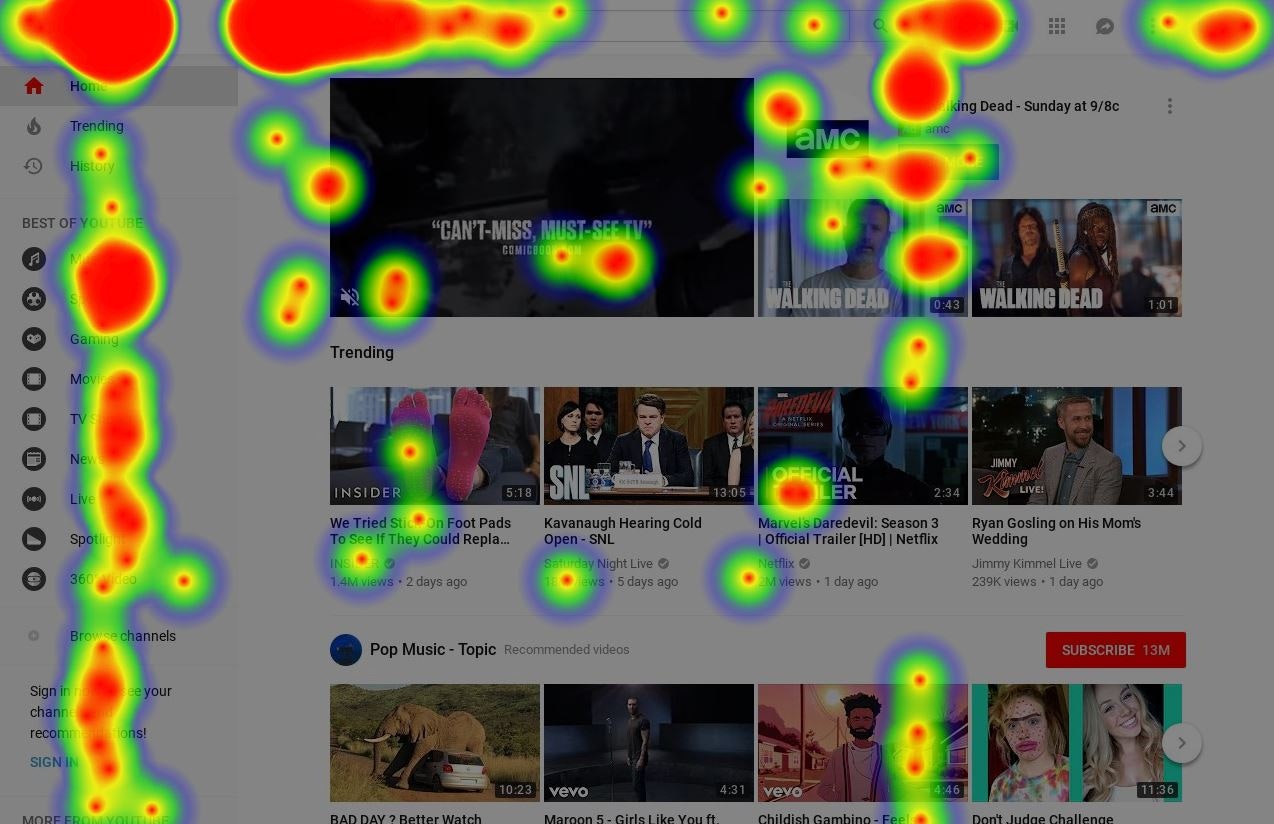
Any website's heatmap data is at your fingertips
2018 · its alternatives →
- 19

- 20

Sample real-time CRUD inventory tracking app built with SocketCluster - SocketCluster/sc-crud-sample
2015 · github.com · its alternatives →
- 21
 Specto▲89
Production profiling and perf monitoring for iOS & Android
2021 · sentry.io · its alternatives →
- 22

- 23

- 24

I am excited to announce the project I am working on: an advanced mobile app profiler for Android. Its primary purpose is to optimize app performance and make it faster. Additionally, it serves as an excellent debugging tool. The main distinction between existing tools, such as Perfetto and the Android Studio Profiler, is the ability to synchronize the trace with a video recording of your app. This allows you to see the app's UX alongside what's occurring within the app to identify what's causing slowdowns. Another key feature is the ability to click on any slice and view the cross-thread…
2024 · crpath.app · its alternatives →
Also compare
- O(log n) makes continuous profiling possible alternatives
- Polar Signals Continuous Profiler – Systematic Performance Profiling alternatives
- Whole-fleet continuous profiler for C/C++/Rust/Go/JVM/Python/Ruby/PHP alternatives
- Real-time application performance monitoring alternatives
- Real-time server monitoring in your browser alternatives
- Py-spy – A new sampling profiler for Python programs alternatives
Ranked by how close each launch is in meaning, then by votes. Prices were read from each product’s own site when checked and can change. Refine with your own description →