Work · alternatives · 2026

24 alternatives to CsvAnimator
.csv files into animated graphs in a click
Below are 24 products that do a similar job, ranked by how close each is in meaning and then by launch-day votes.
- 1
 AnimStats▲933
Get x10 more engagement, grab attention with animated videos
2024 · animstats.com · its alternatives →
- 2
 Vizzu▲225
Open-source JS library to build animated charts with ease
2022 · vizzu.io · its alternatives →
- 3

- 4

Free chart maker & visual exploration for spreadsheet data
2020 · its alternatives →
- 5

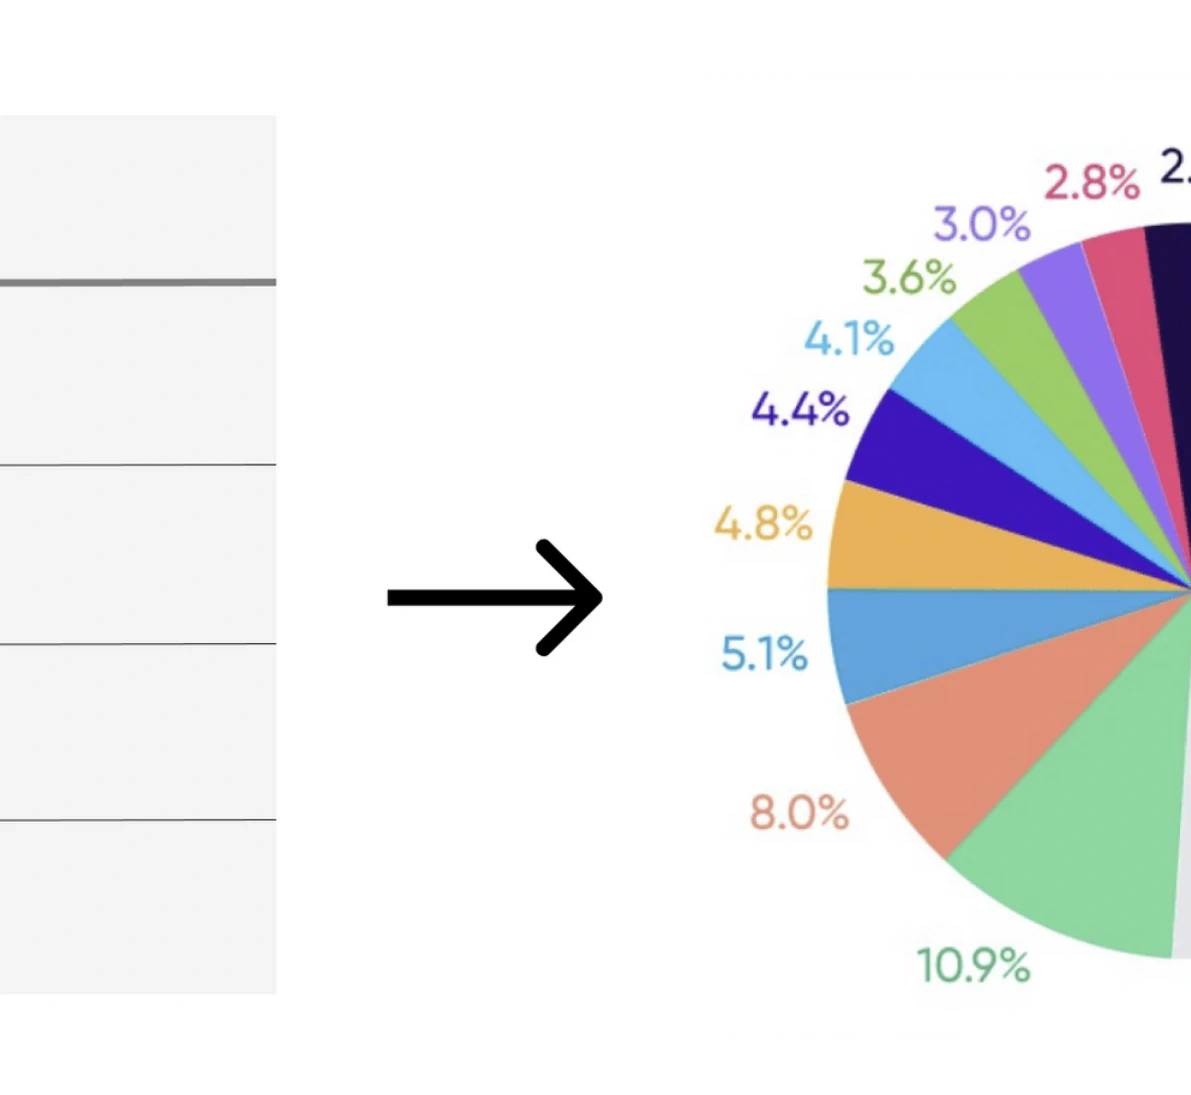
Convert tables stored as images to an usable .csv file - artperrin/image2csv
2021 · github.com · its alternatives →
- 6

- 7VO
vizzu - Library for animated data visualizations and data stories
2021 · lib.vizzuhq.com · its alternatives →
- 8

- 9

- 10

I built a simple tool that converts CSV files into graphs instantly. The idea came from seeing how much time people spend opening spreadsheets or writing code just to visualize data. I wanted something where you can just upload a CSV and get charts immediately. It currently supports quick line and basic chart visualizations from CSV datasets. I’d really appreciate feedback from people who work with data or frequently analyze CSV files.
Mar 2026 · plotiq-web.web.app · its alternatives →
- 11

Build, present and share animated data stories in Jupyter Notebook and similar environments. - vizzuhq/ipyvizzu-story
2022 · github.com · its alternatives →
- 12

Turn your CSVs into share-worthy dashboards
Mar 2026 · dash.upsolve.ai · its alternatives →
- 13
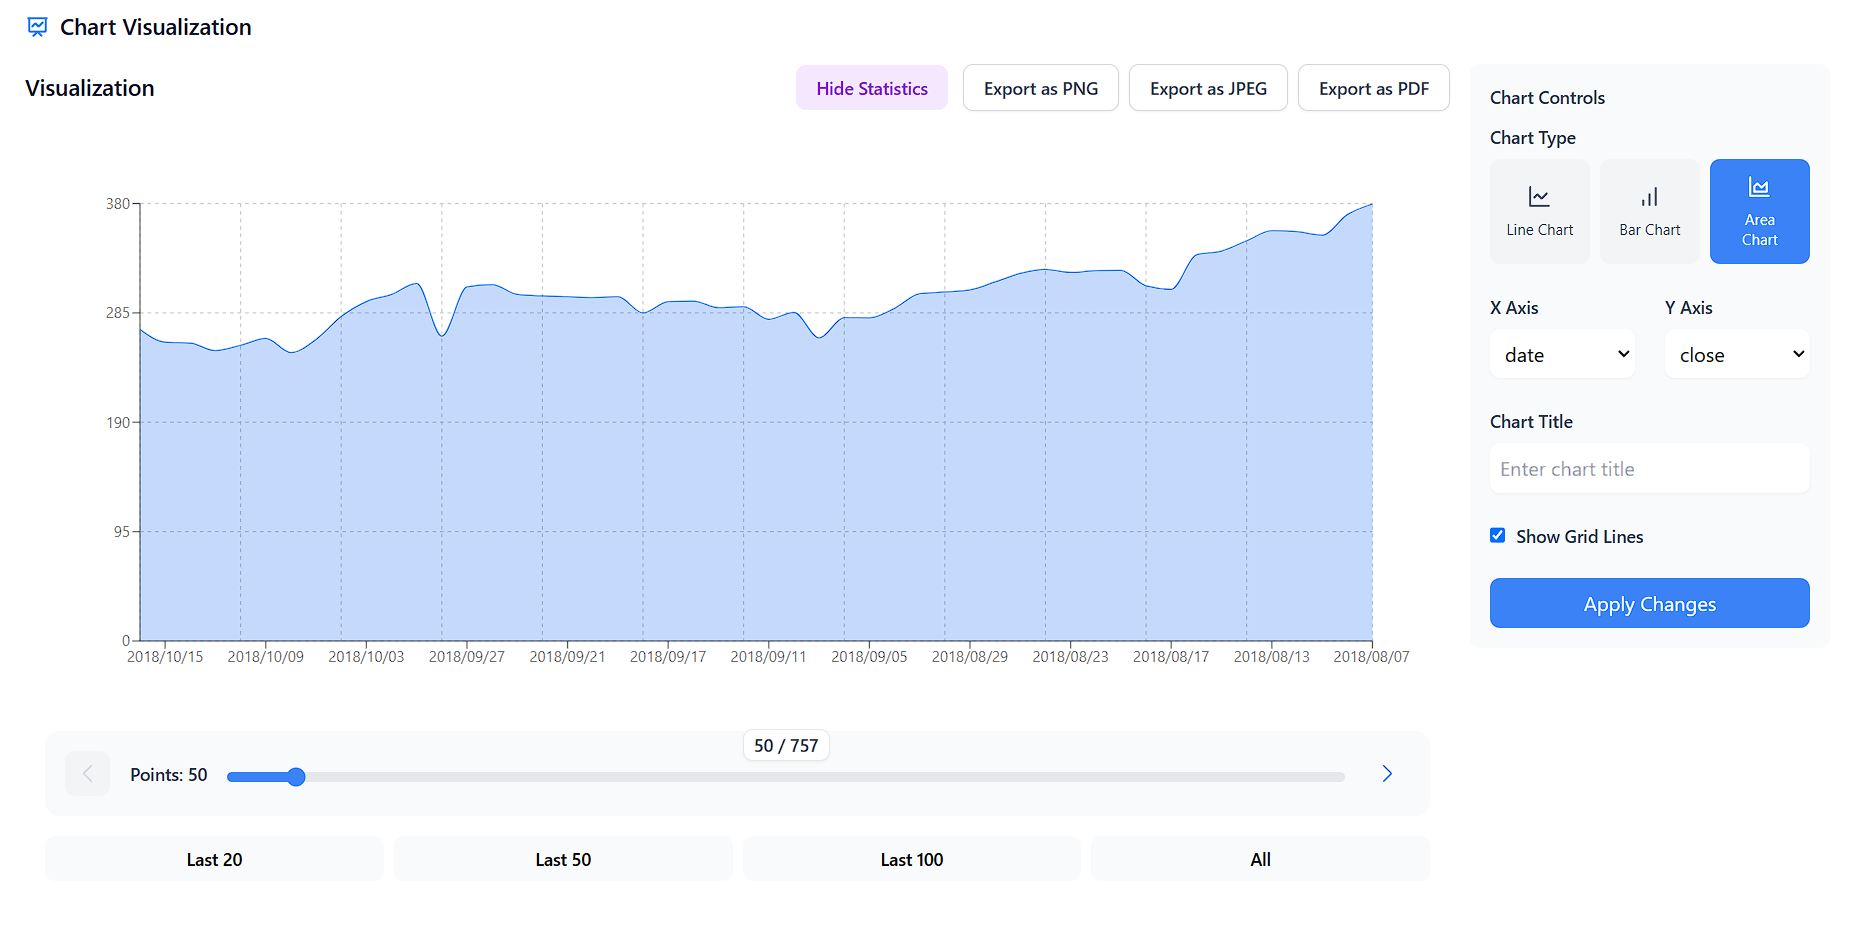
CSV Visualizer: Turn raw data into stunning visuals fast! 📊
2024 · csv-data-visualizer.netlify.app · its alternatives →
- 14
- 15
 CSV Plot▲6
Turn Your CSV Data into Insights in Seconds.
Jan 2026 · csvplot.netlify.app · its alternatives →
- 16

Hi HN, We're a small team working on a new dataviz engine and its applications. We built our charting engine in C++ and run it on WebAssembly. Two years ago, we launched Vizzu as an open-source animated data visualization library aimed at JS developers, allowing users to create dynamic charts. We also released a Python wrapper under the name ipyvizzu for data scientists. Since then, we've been working hard to make this technology accessible to everyone, regardless of their coding skills. Today, we're proud to introduce our no-code storytelling tool. With this tool, anyone can turn their…
2024 · vizzu.io · its alternatives →
- 17

Build animated charts in Jupyter Notebook and similar environments with a simple Python syntax. - vizzuhq/ipyvizzu
2022 · github.com · its alternatives →
- 18

- 19

- 20

After releasing our open-source tool to build animated charts in Jupyter and other computational notebooks (https://news.ycombinator.com/item?id=30895975), we got two requests from data scientists: 1. They lacked the opportunity to use these charts to present their findings and control the animation better than just (re)running notebook cells. 2. They had challenges using our generic chart-building engine - they are more acquainted with picking a chart type and using the parameters specific to that type. So we decided to build a new extension that enables our users to add the…
2022 · github.com · its alternatives →
- 21

- 22

A demonstrates of the use of the CSS clip-path property in combination with CSS variables and CSS transitions to create a low-poly animated Pokémon.
2016 · projects.lukehaas.me · its alternatives →
- 23

- 24
 VizzyCharts▲67
Quickly generate editable graphs and charts in Adobe XD.
2019 · vizzycharts.com · its alternatives →
Also compare
Ranked by how close each launch is in meaning, then by votes. Prices were read from each product’s own site when checked and can change. Refine with your own description →