Dev tools · alternatives · 2026

24 alternatives to Plotiq – Turn CSV files into graphs instantly
I built a simple tool that converts CSV files into graphs instantly. The idea came from seeing how much time people spend opening spreadsheets or writing code just to visualize data. I wanted something where you can just upload a CSV and get charts immediately. It currently supports quick line and basic chart visualizations from CSV datasets. I’d really appreciate feedback from people who work with data or frequently analyze CSV files.
Below are 24 products that do a similar job, ranked by how close each is in meaning and then by launch-day votes.
- 1

- 2

- 3
 CSV Plot▲6
Turn Your CSV Data into Insights in Seconds.
Jan 2026 · csvplot.netlify.app · its alternatives →
- 4

- 5
 DataSquirrel.ai▲268
Fastest way: csv/xls to dashboard report, no ChatGPT upload
2023 · datasquirrel.ai · its alternatives →
- 6

- 7

I built CSV GB+ by Data.olllo, a local data tool that lets you open, clean, and export gigabyte-sized CSVs (even billions of rows) without writing code. Most spreadsheet apps choke on big files. Coding in pandas or Polars works—but not everyone wants to write scripts just to filter or merge CSVs. CSV GB+ gives you a fast, point-and-click interface built on dual backends (memory-optimized or disk-backed) so you can process huge datasets offline. Key Features: Handles massive CSVs with ease — merge, split, dedup, filter, batch export Smart engine switch: disk-based "V Core" or RAM-based "P…
2025 · apps.microsoft.com · its alternatives →
- 8DT
2020 · dropbase.castodia.com · its alternatives →
- 9
- 10

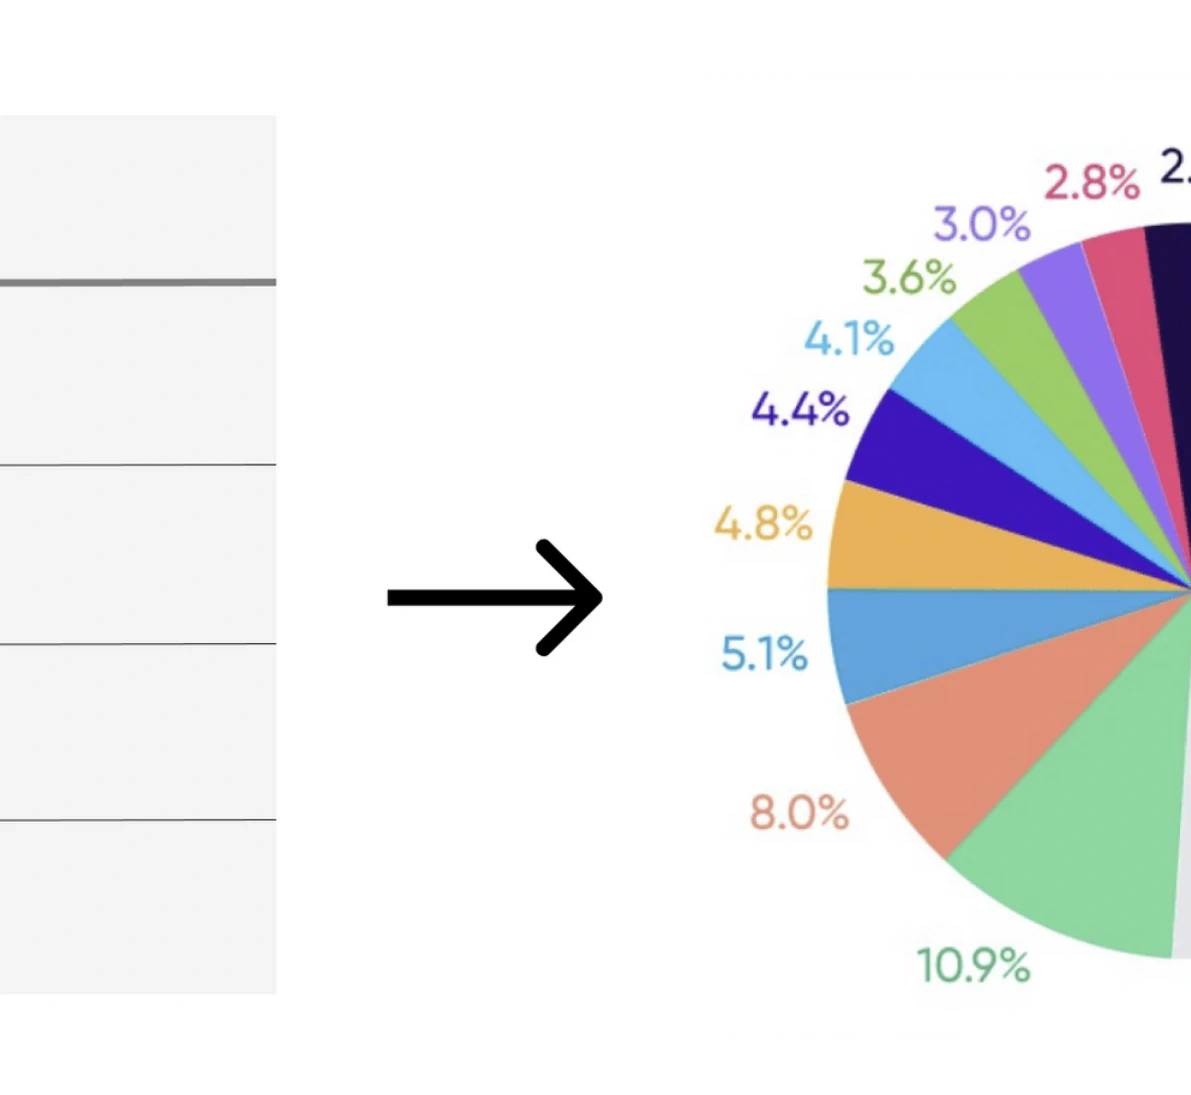
Use CSV to Graph Online to upload or paste CSV data and create line charts, bar charts, scatter plots, and CSV visualizations for free.
Jun 2026 · csv.qingyanglabs.com · its alternatives →
- 11

Simple XLSX and CSV to dictionary converter. Contribute to Pytlicek/sheet2dict development by creating an account on GitHub.
2021 · github.com · its alternatives →
- 12
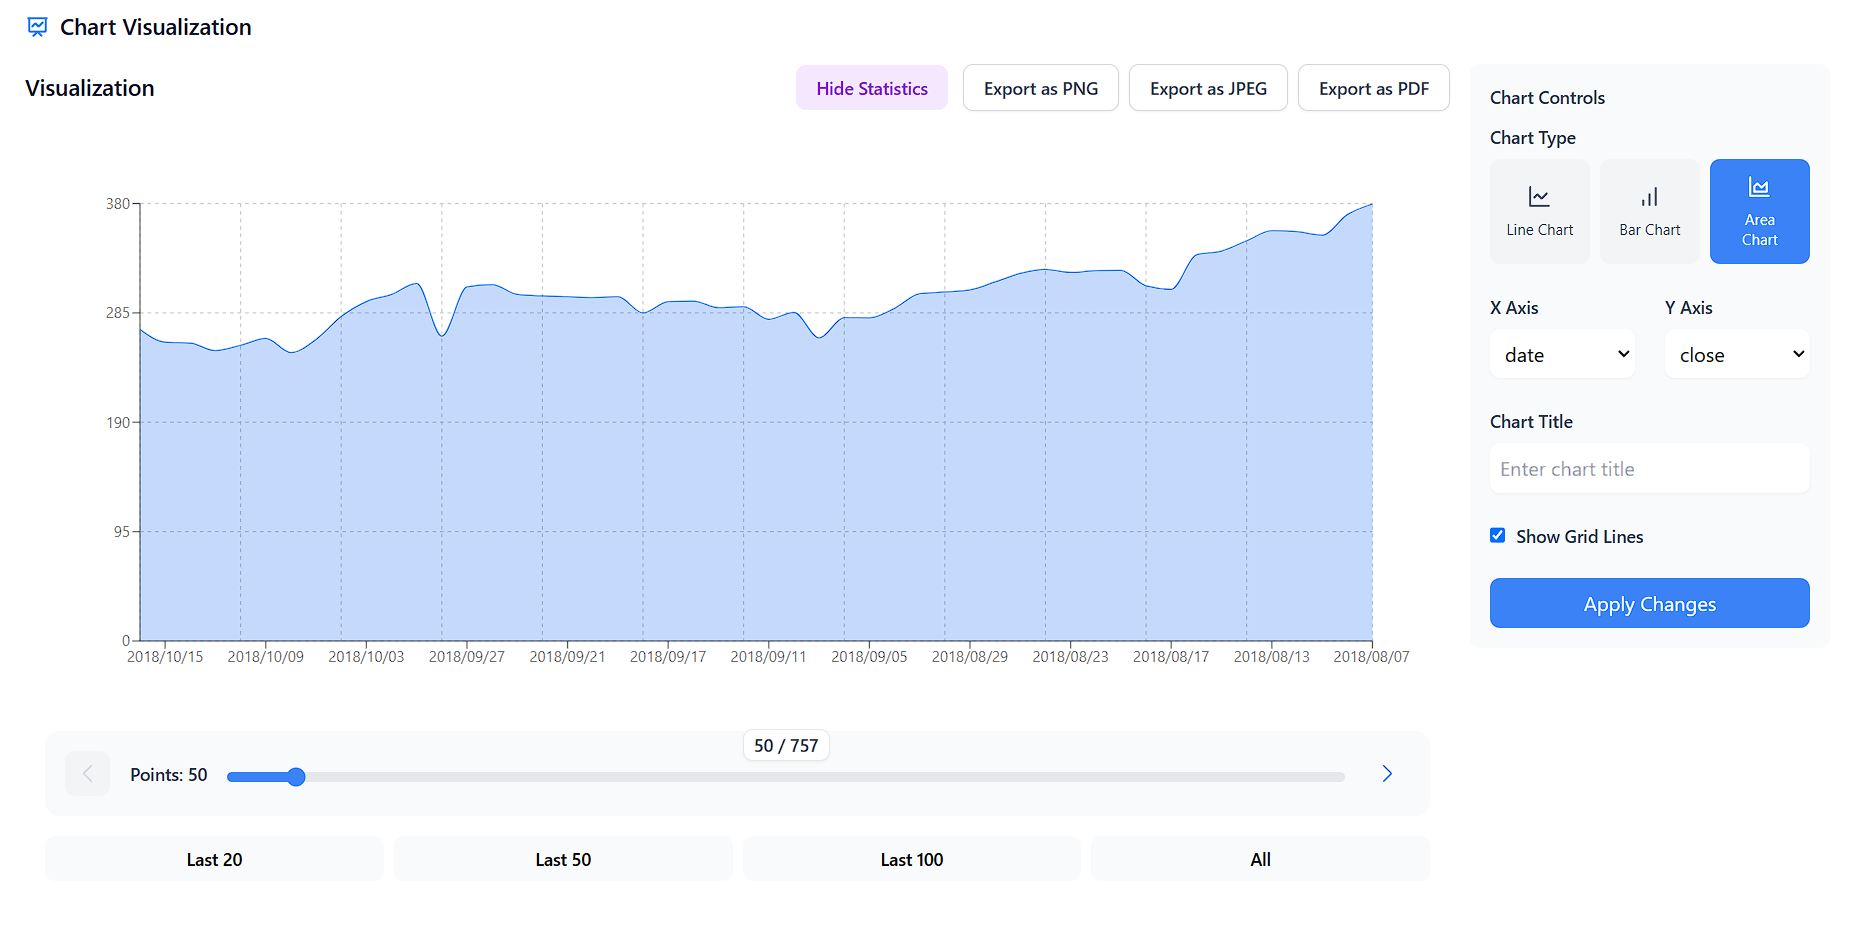
CSV Visualizer: Turn raw data into stunning visuals fast! 📊
2024 · csv-data-visualizer.netlify.app · its alternatives →
- 13

Flexible command line tool to create graphs from CSV data - mcastorina/graph-cli
2018 · github.com · its alternatives →
- 14
- 15

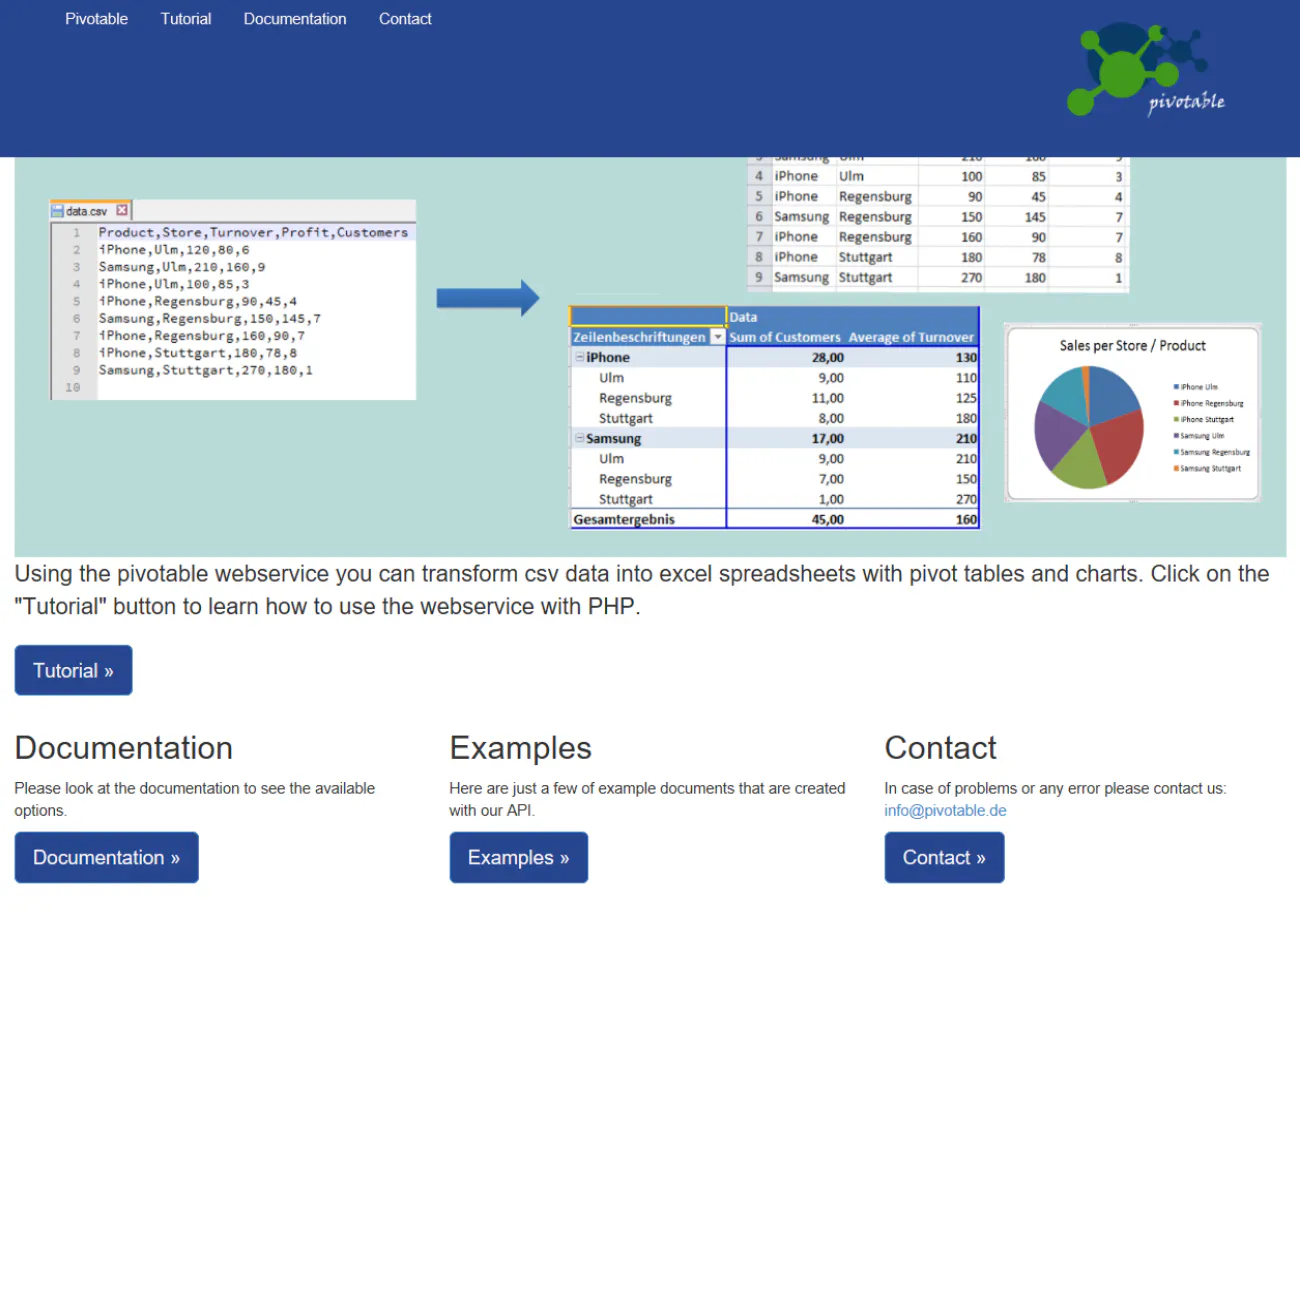
.csv files into animated graphs in a click
2025 · atomotion.gumroad.com · its alternatives →
- 16

- 17
 iPlotCSV▲2
iPlotCSV is a web tool for visualizing CSVs. Drop your file, pick your columns, get an interactive chart. That's it. No signup. Includes a full suite of post processing tools, filters, engineering functions for strain gauges, etc. We all know setting up python or creating slow and non interactive charts in Excel sucks.
Feb 2026 · iplotcsv.com · its alternatives →
- 18

Hello HN, I'm excited to share a project I've been working on: A simple, fast way to process huge CSV and XLSX files directly in your browser and export them as clean JSON or XML Here's a few things that makes this converter different: - runs in the browser - all parsing and conversion is client side can handle data any size data - automatically detects delimiters, encodings, and data types as it parses - Live preview with column renaming, search/replace, and data cleanup - Export to JSON or XML — clean, structured output that can be used for API or Databases backstory: I built this…
2025 · csvforge.com · its alternatives →
- 19PI
2015 · copypastecsv.herokuapp.com · its alternatives →
- 20
 GraphCSV▲2
Turn messy CSV files into beautiful dashboards instantly.
Aug 2026 · graphcsv.com · its alternatives →
- 21
- 22
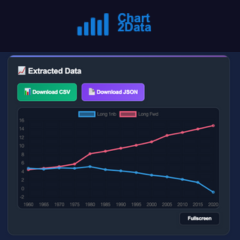 Chart2Data▲15
Turn any chart into clean, usable data in seconds with AI
2025 · chart2data.com · its alternatives →
- 23

A free tool to create beautiful charts from your CSV/TSV data. This is an excellent alternative to Excel/Google Sheets (not-so-good-looking) charts.
2024 · textquery.app · its alternatives →
- 24

Turn Tables Into Stunning Graphs-No Coding, Just Clarity!
2025 · its alternatives →
Also compare
Ranked by how close each launch is in meaning, then by votes. Prices were read from each product’s own site when checked and can change. Refine with your own description →