AI · alternatives · 2026

24 alternatives to DataContours
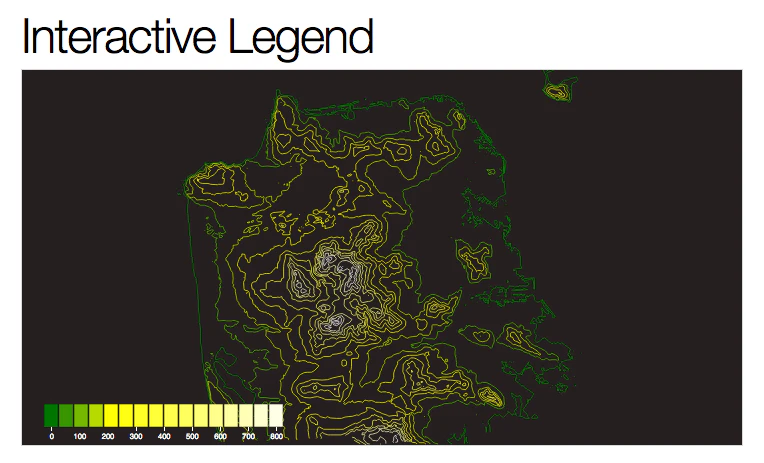
3D modelling and data visualization for places.
Below are 24 products that do a similar job, ranked by how close each is in meaning and then by launch-day votes. Prices are shown for the 1 we have checked on their own sites, 1 of them free or with a free tier. DataContours launched in 2020; newer entries below may have overtaken it.
- 1

Create pro-level graphs that drive actions
2024 · graphy.app · its alternatives →
- 2

- 3

Creating data visualizations with AI nowadays often means chat, chat and more chats...and writing long prompts can be annoying while they are also not the most effective way to describe your visualization designs. Data Formulator blends UI interaction with natural language so that you can create visualizations with AI much more effectively! You can: * create rich visualizations beyond initial datasets, where AI helps transforming and visualizing data along the way * iterate your designs and dive deeper using data threads, a new way to manage your conversation with AI. Here is a demo video:…
2024 · github.com · its alternatives →
- 4

Reference tool for data visualisation
2016 · datavizcatalogue.com · its alternatives →
- 5
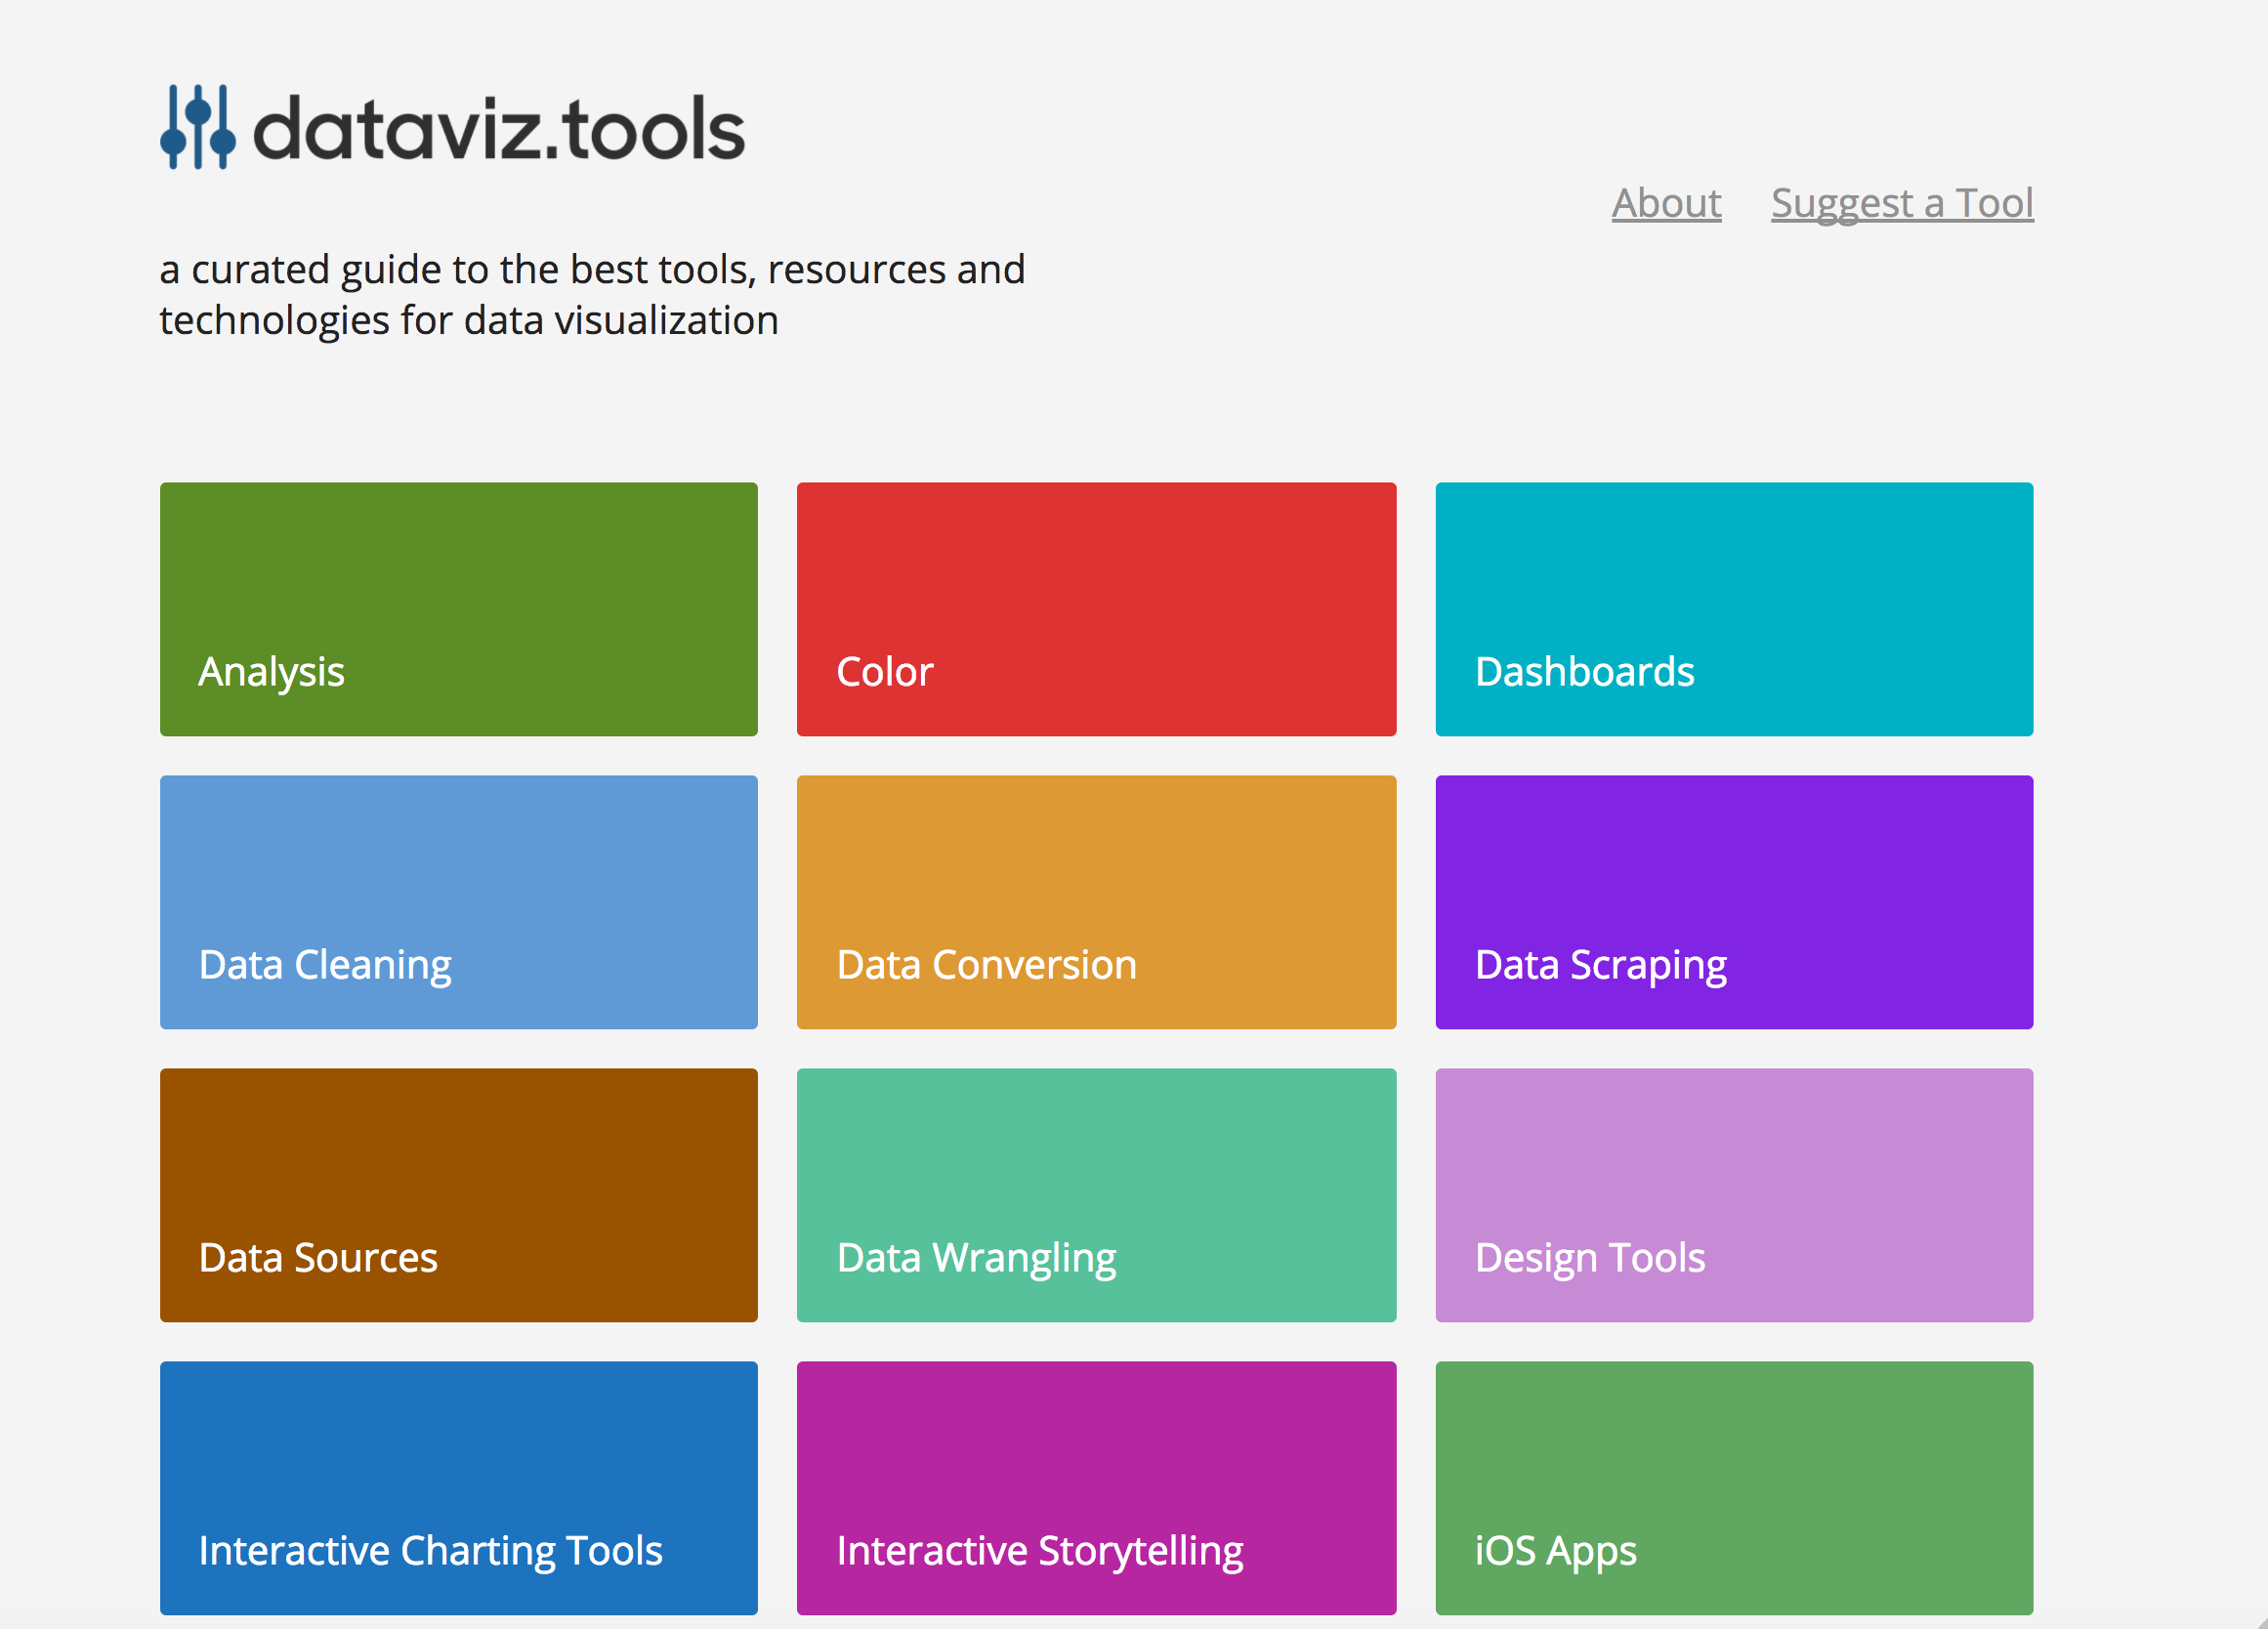 dataviz.tools▲409
Curated collection of the 400 best data visualization tools
2017 · dataviz.tools · its alternatives →
- 6

- 7VM
Topological visualizations for the masses
2020 · topovis.iambeef.com · its alternatives →
- 8

Pathfinding visualizer on a real map, anywhere in the world
2024 · honzaap.github.io · its alternatives →
- 9

A framework for 3D geospatial visualization in the browser - UDST/vizicities
2016 · github.com · its alternatives →
- 10

- 11
 CalcGen AI▲123
Beautifully interactive data visualizations. One prompt.
2024 · welcome.calcgen.ai · its alternatives →
- 12IT
Experiments in expressing statistical thinking with interactive design
2015 · r2d3.us · its alternatives →
- 13

Data analysis that works for engineers. World-leading time series data analysis platform for engineering teams.
2020 · getmarple.io · its alternatives →
- 14

- 15IE
2017 · mjmdavis.com · its alternatives →
- 16

- 17MO
2018 · anvaka.github.io · its alternatives →
- 18

Flexible tool to build planet-scale vector tilesets from OpenStreetMap data fast - onthegomap/planetiler
2021 · github.com · its alternatives →
- 19IM
2017 · xyz.insightdataengineering.com · its alternatives →
- 20
- 21

3D geographic visualization library. Contribute to w3reality/three-geo development by creating an account on GitHub.
2018 · github.com · its alternatives →
- 22

Catalog of all chart types and tools to build them
2017 · visualizationuniverse.com · its alternatives →
- 23ND
2014 · blog.spritesapp.com · its alternatives →
- 24

Hi HN, I started building Datastripes as part of my thesis, trying to answer a simple question: How can non-technical teams turn raw data into insights without relying on developers or BI tools? What began as research has now grown into a working product, built by a small team, focused on solving that exact problem. Datastripes is a no-code platform for creating dashboards and data visualizations in minutes: no SQL, no setup, no friction. What it does: Connects to CSVs, Google Sheets, or APIs Drag-and-drop dashboard builder Shareable via public links or embed Fully browser-based We’re…
Jan 2026 · datastripes.com · its alternatives →
Also compare
Ranked by how close each launch is in meaning, then by votes. Prices were read from each product’s own site when checked and can change. Refine with your own description →