Growth · alternatives · 2026

24 alternatives to Datuum
Visualize Data...Your way
Below are 24 products that do a similar job, ranked by how close each is in meaning and then by launch-day votes. Prices are shown for the 5 we have checked on their own sites, 4 of them free or with a free tier.
Only the free ones: free alternatives to Datuum →
- 1

- 2

- 3
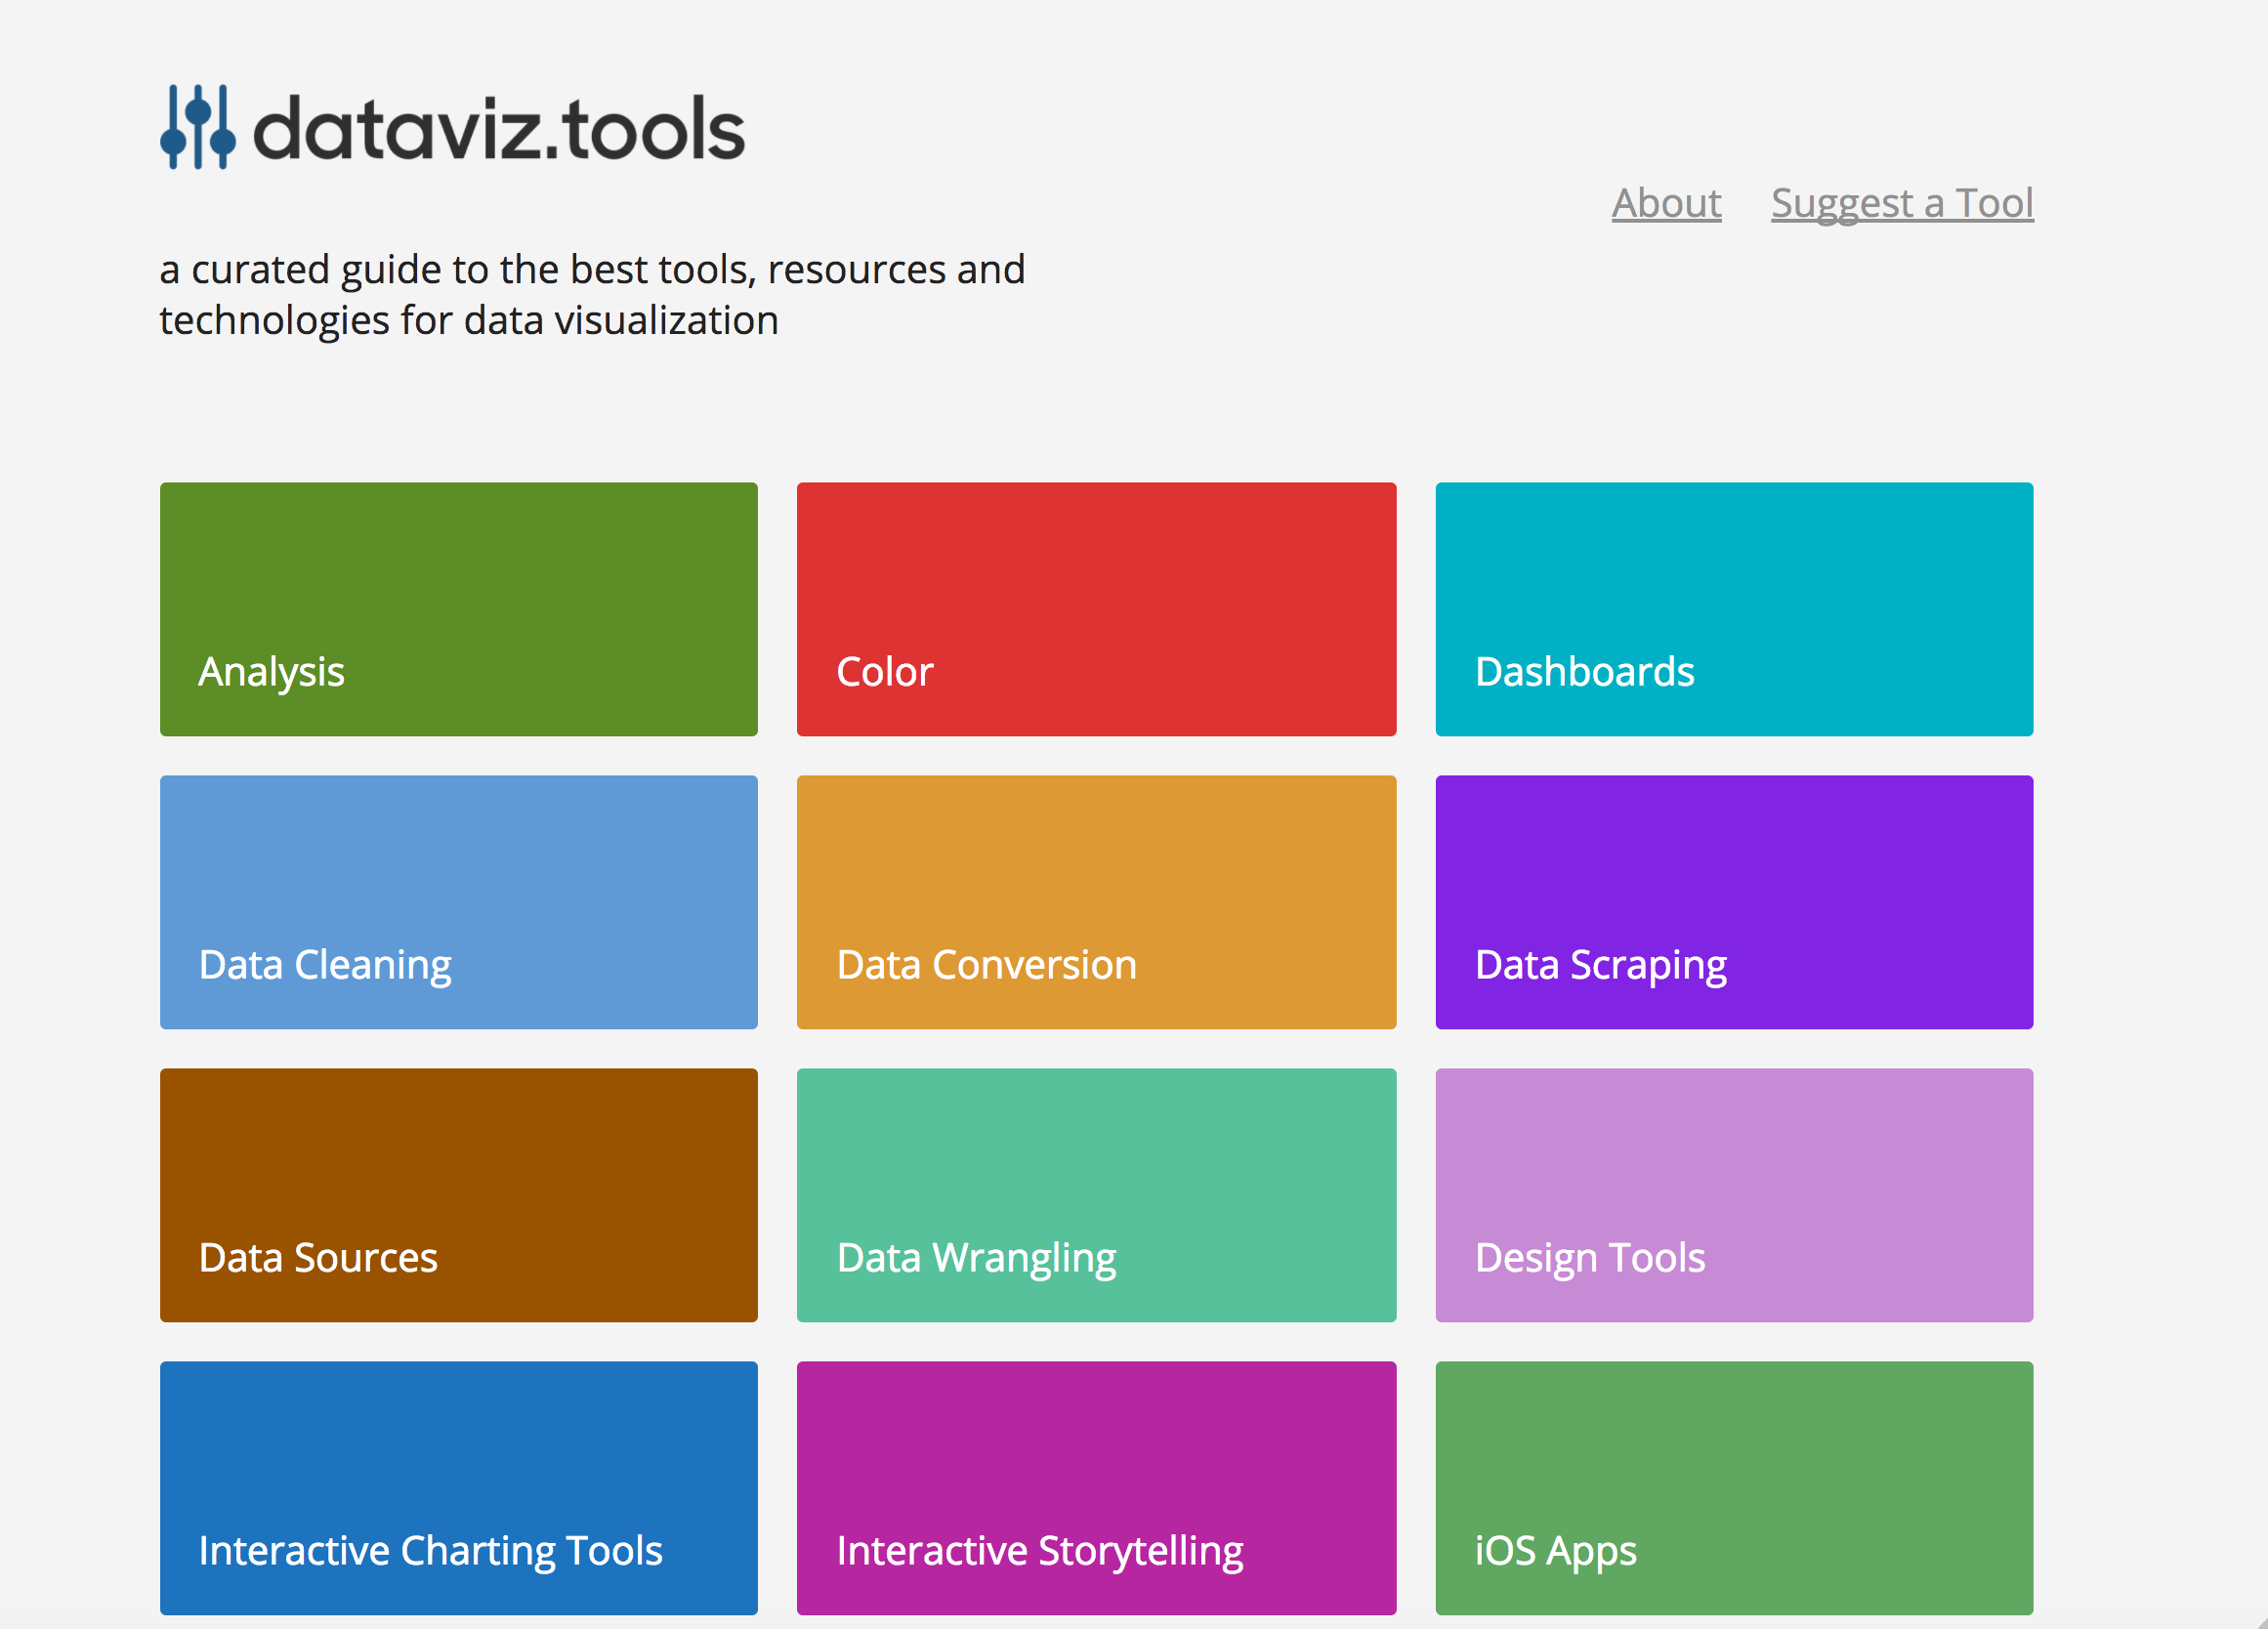 dataviz.tools▲409
Curated collection of the 400 best data visualization tools
2017 · dataviz.tools · its alternatives →
- 4

ChartDB is a tool that generates entity-relationship diagrams from database schemas using a single query, designed for developers and data analysts.
2024 · github.com · its alternatives →
- 5TL
Tableau-Like Data Visualizations in JavaScript is a charting library launched in 2018 that enables developers to create interactive data visualizations similar to Tableau.
2018 · charts.com · its alternatives →
- 6

- 7
 Data Formulatorfree▲212
Creating data visualizations with AI nowadays often means chat, chat and more chats...and writing long prompts can be annoying while they are also not the most effective way to describe your visualization designs. Data Formulator blends UI interaction with natural language so that you can create visualizations with AI much more effectively! You can: * create rich visualizations beyond initial datasets, where AI helps transforming and visualizing data along the way * iterate your designs and dive deeper using data threads, a new way to manage your conversation with AI. Here is a demo video:…
2024 · github.com · its alternatives →
- 8

Charts and infographics constructor in Figma
2021 · store.123d.one · its alternatives →
- 9

Visualize SQL Queries is a web-based tool that animates SQL operations to help users understand how queries work.
2022 · animatesql.com · its alternatives →
- 10
 Vizzu▲223
Vizzu is a data visualization platform built on a C++ charting engine running on WebAssembly.
2022 · vizzu.io · its alternatives →
- 11

Free chart maker & visual exploration for spreadsheet data
2020 · its alternatives →
- 12

- 13

- 14
 Chartmat▲98
Build dashboard and apps on top of Google Sheets
2021 · chartapps.com · its alternatives →
- 15
 dbdiagram.io▲176
Quick and simple free tool to help you draw your database relationship diagrams and flow quickly using simple DSL language.
2018 · dbdiagram.io · its alternatives →
- 16VVisprexfree▲194
Visprex is an open-source, browser-based tool that automatically generates data visualizations from CSV files.
2024 · docs.visprex.com · its alternatives →
- 17
 Data Painter▲179
Data Painter is RATH's new feature to interact with your data. It helps you to specify complex visual patterns and find explanations and potential causals. It allows you to do on-flight data labeling, cleaning or even create new features does not exited in original dataset. Everything can be done with a brush tool(painter), You can even play with your data with your fingers on mobile. RATH is an open-source alternative to Tableau, but with more automations. Feedbacks and suggestions are appreciated. RATH's Github: https://github.com/Kanaries/Rath RATH's HomePage:…
2023 · docs.kanaries.net · its alternatives →
- 18

Reference tool for data visualisation
2016 · datavizcatalogue.com · its alternatives →
- 19

- 20

Learn how to use this simple free tool dbdiagram.io to visualize your Rails ERD diagram, made by Holistics
2018 · holistics.io · its alternatives →
- 21

- 22

Catalog of all chart types and tools to build them
2017 · visualizationuniverse.com · its alternatives →
- 23
 Tractorscopefrom $49/mo▲87
The developer’s data visualization platform
2024 · tractorscope.com · its alternatives →
- 24

This tool generates SVG diagrams from SQLAlchemy data models, making it easier to visualize database schemas and relationships.
2023 · github.com · its alternatives →
Also compare
Ranked by how close each launch is in meaning, then by votes. Prices were read from each product’s own site when checked and can change. Refine with your own description →