Dev tools · alternatives · 2026

24 alternatives to Excel Dashboard Toolkit
Making engaging design more accessible to Excel users.
Below are 24 products that do a similar job, ranked by how close each is in meaning and then by launch-day votes. Prices are shown for the 1 we have checked on their own sites, 1 of them free or with a free tier. Excel Dashboard Toolkit launched in 2019; newer entries below may have overtaken it.
- 1
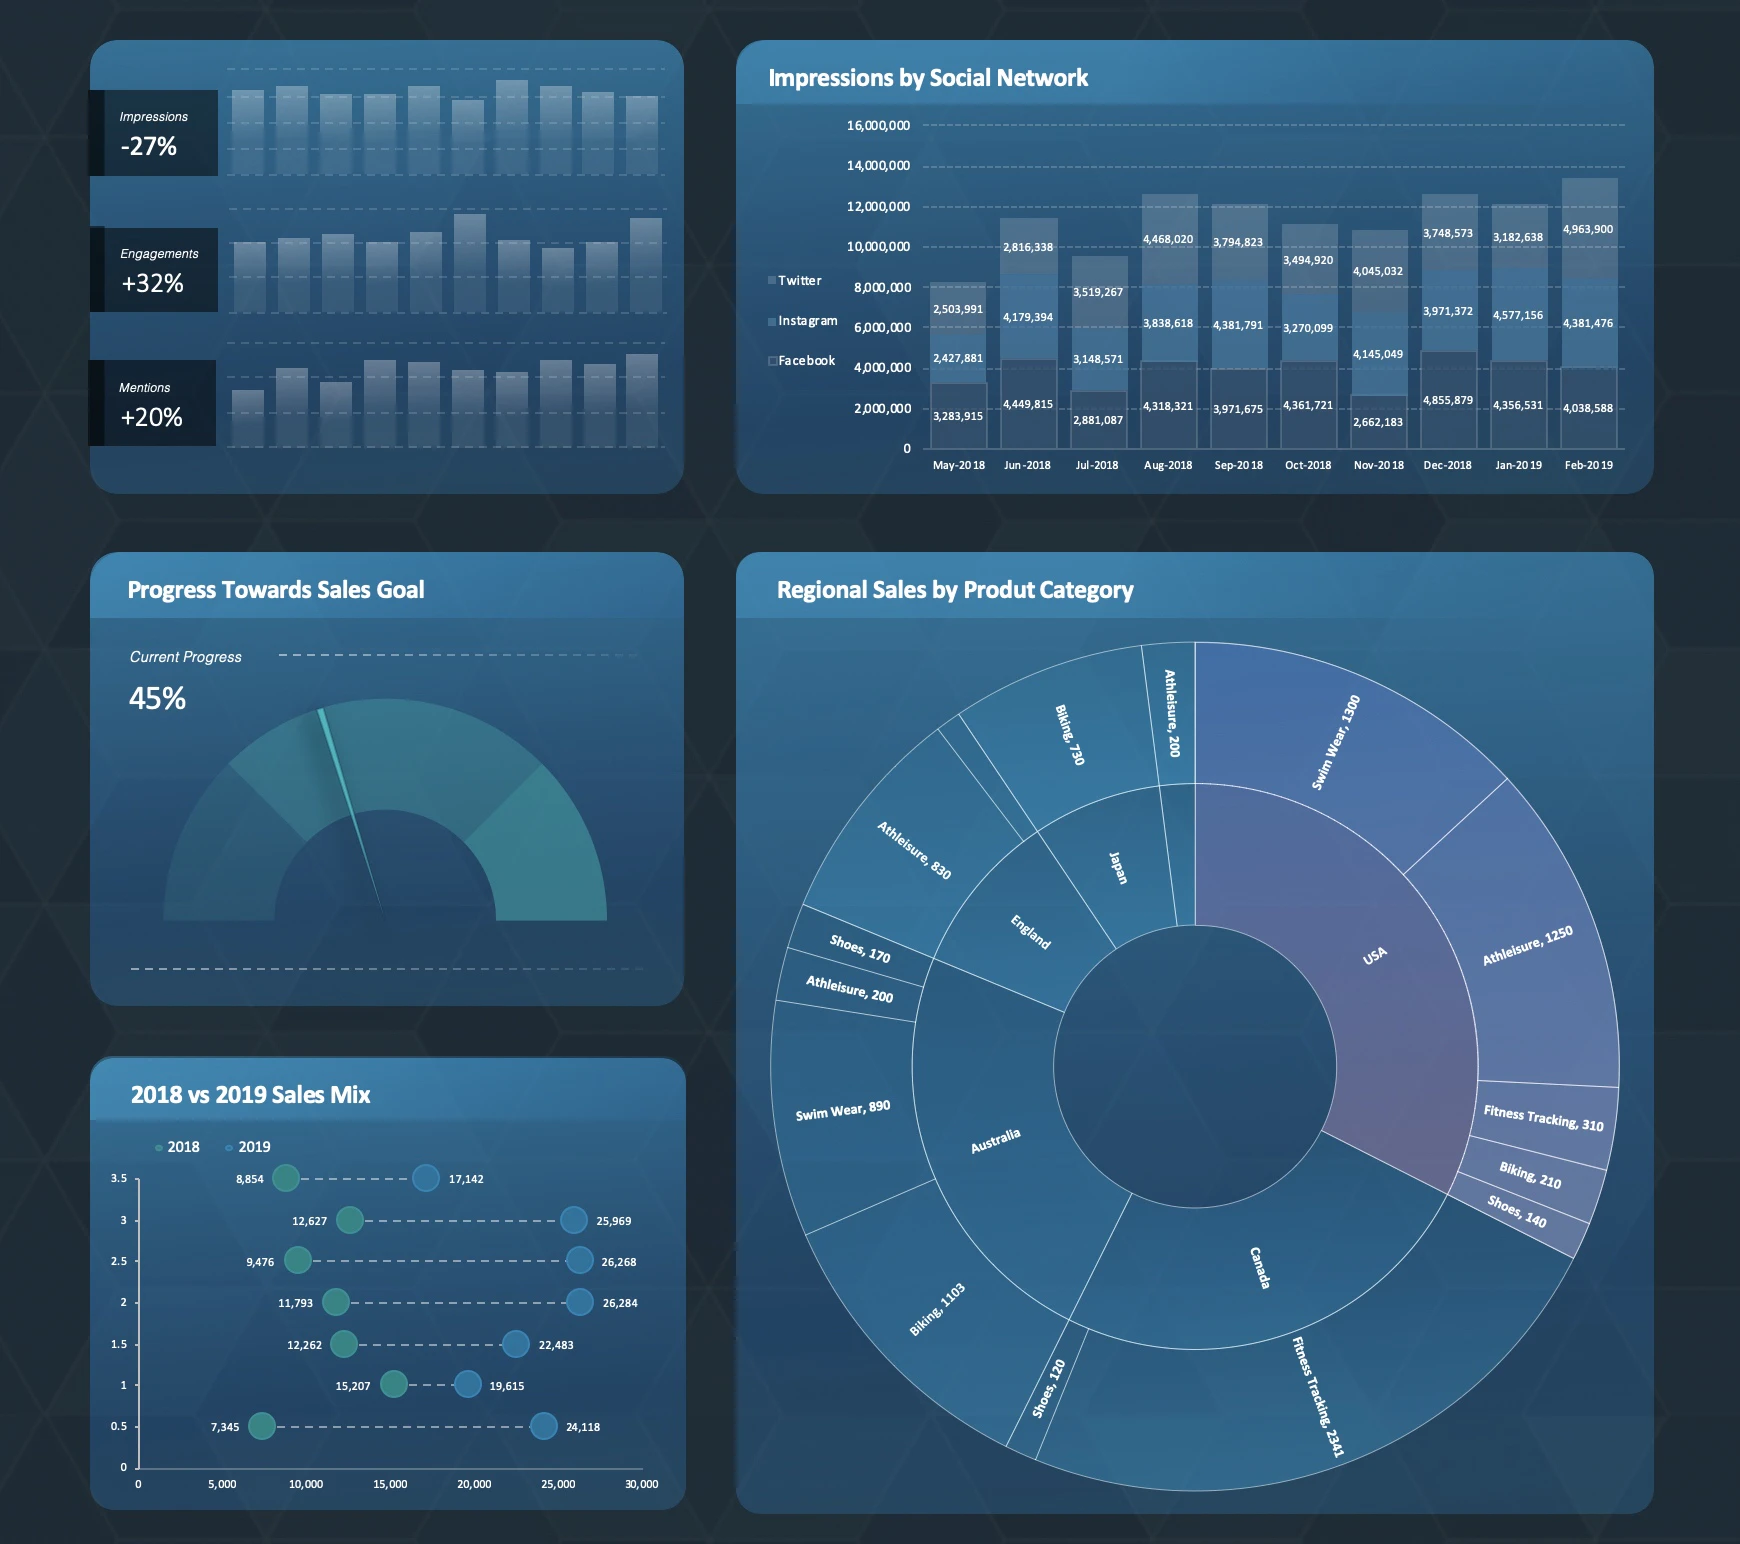
Making Excel pretty with copy-pasteable charts and designs
2022 · exceldashboardtemplate.com · its alternatives →
- 2
 Shape 2▲540
5000+ fully customizable assets for your web design projects
2020 · shape.so · its alternatives →
- 3

Free chart maker & visual exploration for spreadsheet data
2020 · its alternatives →
- 4
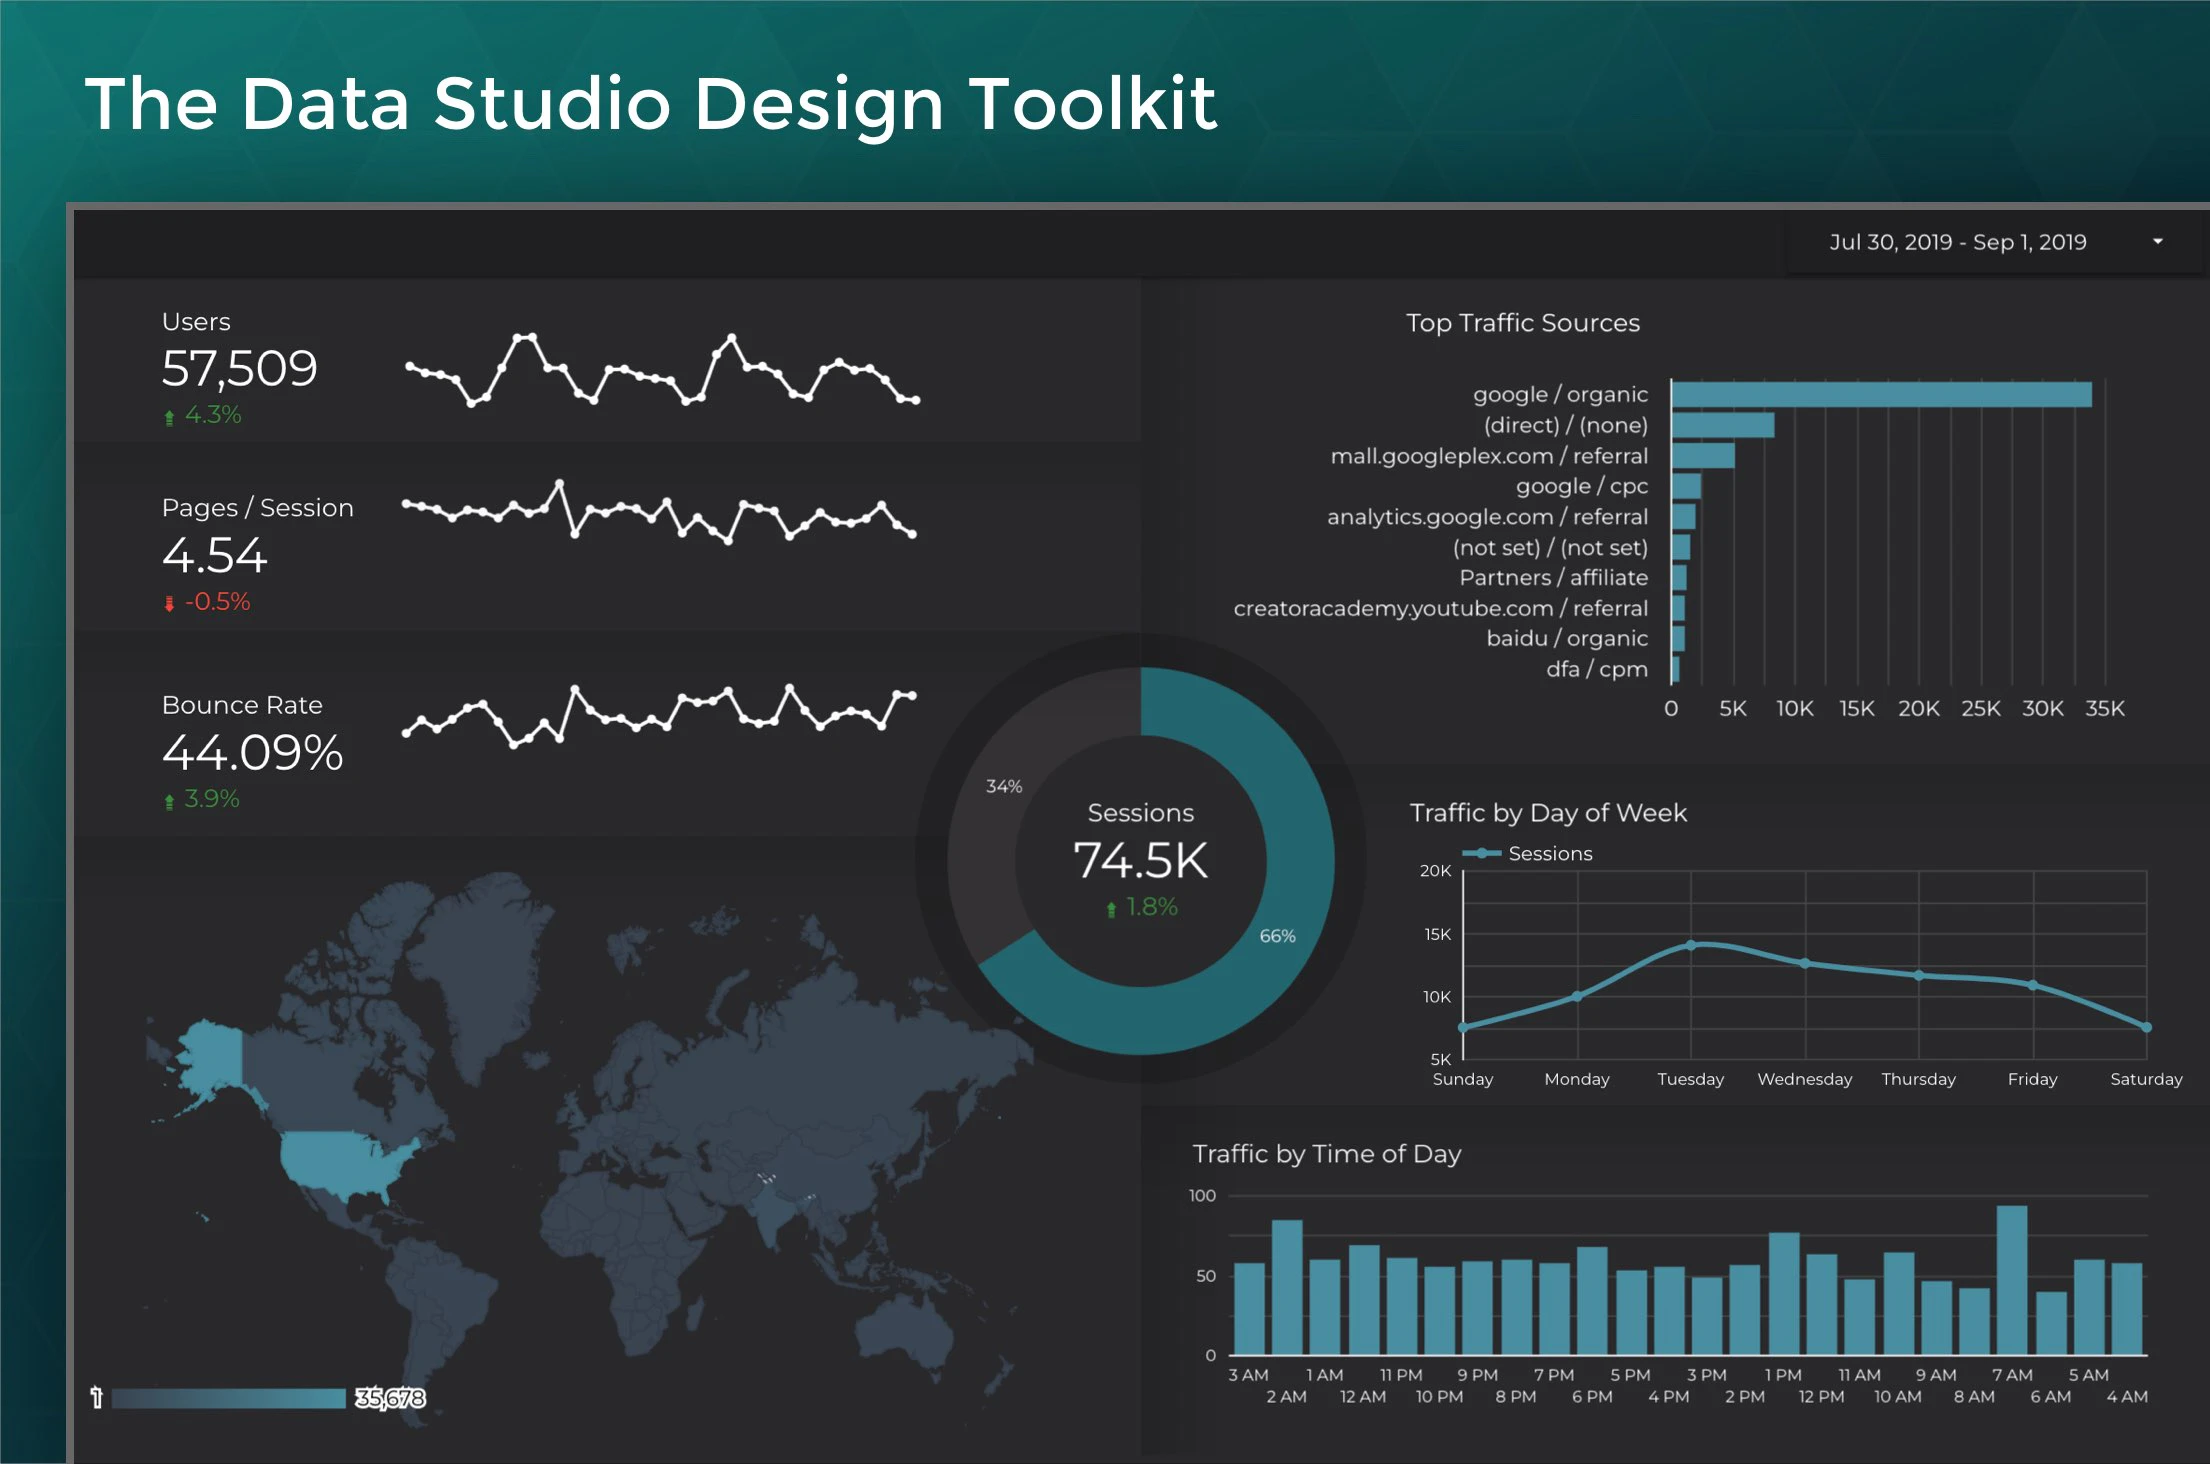
Copy-pasteable GDS dashboards, UI elements & styles
2022 · bymarketers.co · its alternatives →
- 5

- 6

The largest design kit for creating dashboards, now in React
2018 · dashboard-ui.com · its alternatives →
- 7
 Excel Dashboard Aifree tier, from $7.43/mo▲158
Hey everyone! I'm Alex, the co-founder of Excel Dashboard Ai. I’m excited to share our AI tool that turns your Excel data into awesome dashboards and detailed reports. Think visualized charts, diverse analysis angles, and almost 10,000 words of AI-driven insights—all in one place. Say goodbye to endless hours of data analysis and report writing. ExcelDashboard is here to boost your productivity! Why did we build this? Back in my previous company, we were constantly asked for data-driven insights and long reports. This process was a huge time drain. I used to joke, "Wouldn't it be great if…
2024 · exceldashboard.ai · its alternatives →
- 8

The ultimate tool for automated marketing reporting in Excel
2019 · supermetrics.com · its alternatives →
- 9
 Dashboard UI Kit▲326
A modern & responsive dashboard UI kit for designers.
2016 · dashboarduikit.com · its alternatives →
- 10
 DashGPT▲287
I guys, I built this spreadsheet to dashboard tool. You can attach any csv and optionally a prompt for what insights you want it to include, and it reasons over the data and produces a dashboard of different charts. Let me know what y'all think! Demo Video/more here: https://www.producthunt.com/products/spreadsite/launches/das...
2024 · dashgpt.ai · its alternatives →
- 11
 dataviz.tools▲409
Curated collection of the 400 best data visualization tools
2017 · dataviz.tools · its alternatives →
- 12

- 13

- 14

- 15

Curated Excel templates by Clientjoy
2021 · clientjoy.io · its alternatives →
- 16

Reference tool for data visualisation
2016 · datavizcatalogue.com · its alternatives →
- 17

- 18

Ultimate Dashboard UI Kit with 150 Screens
2019 · iconspace.co · its alternatives →
- 19
The biggest data visualization design kit for Sketch
2020 · crafted.graphics · its alternatives →
- 20SD
2016 · gisxl.com · its alternatives →
- 21

Chart templates kit for dashboards prototyping
2018 · setproduct.com · its alternatives →
- 22E2Excel 2013▲20
Not exactly a side project but my work for the last 2.5 years. As an avid HN lurker would love to hear feedback. Background: I am a PM on the Excel team in charge of the advanced data analysis tools (http://www.microsoft.com/en-us/bi/Products/OfficePreview.aspx) To download: http://www.microsoft.com/office/preview/en
2012 · microsoft.com · its alternatives →
- 23BO
Hi HN We’ve been building Bricks to make dashboard creation as simple as dropping a file. You upload your data and Bricks does the rest: • Detects the structure • Picks the most useful charts and tables • Generates plain language insights and summaries • Applies a theme • Lets you add blocks using a natural language prompt • Exports to PDF or shares as a live link We built this because creating clean dashboards from spreadsheets felt way harder than it should be. We’d love your feedback on: • How useful the first dashboard feels • Any missing chart types or formats • Anything else that could…
2025 · app.thebricks.com · its alternatives →
- 24
Transform Excel Data into Stunning Charts Effortlessly
2025 · its alternatives →

Also compare
Ranked by how close each launch is in meaning, then by votes. Prices were read from each product’s own site when checked and can change. Refine with your own description →