Dev tools · alternatives · 2026

24 alternatives to Factorio Blueprint Visualizer
A python library to artfully visualize Factorio Blueprints and an interactive web demo for using it. - piebro/factorio-blueprint-visualizer
Factorio Blueprint Visualizer is a tool for players of the factory-building game Factorio. It displays blueprint strings—the code that represents in-game factory layouts—as visual diagrams. The tool helps players plan… Below are 24 products that do a similar job, ranked by how close each is in meaning and then by launch-day votes. Prices are shown for the 1 we have checked on their own sites, 1 of them free or with a free tier. Factorio Blueprint Visualizer launched in 2021; newer entries below may have overtaken it.
- 1

Hey there, I'm a big fan of the game Factorio and the beauty of factories in the game. That's why I created a website to artfully visualize Factorio blueprints a few years ago. With the new 2.0 update, a few things broke. I took the opportunity to rewrite everything from Python to JavaScript and support Factorio 2.0 and the Space Age DLC. It's now also possible to easily modify the style of the drawings. Let me know if you find any bugs or if you have ideas for features.
2025 · github.com · its alternatives →
- 2
 Framer Design▲1,008
Design, code and collaborate. Now all-in-one.
2017 · framer.com · its alternatives →
- 3

Pts is a javascript library for visualization and creative-coding.
2018 · ptsjs.org · its alternatives →
- 4

For the past three years I've been building what I hope will be the next Blender, tackling the lack of any good 2D design or image editing tools outside the Adobe monopoly. This was our first year participating in Google Summer of Code and this Q3 update includes the big payoff from that, covering the most progress we've made so far as a project. If you're a Rust dev, consider getting involved as we apply for the next GSoC in the new year— you could be our intern next summer :) Q3 progress report: https://graphite.rs/blog/graphite-progress-report-q3-2024/
2024 · graphite.rs · its alternatives →
- 5

- 6

Data visualizations are the bridge between user and data. But building AI agents that can generate visualizations reliably can be very tricky: - simple chart specs can be reliable, but generated charts are often of low quality due to reliance on system defaults; - complex chart specs with explicit details can produce good-looking charts, but they are verbose and agents can struggle with reliability We figured out it is a limitation on the language issue (not just AI capability thing) -- current visualization languages are a bit too low-level for AI agents, requiring them to explicitly make…
Jul 2026 · microsoft.github.io · its alternatives →
- 7

An extension for VS Code that visualizes data during debugging. - vscode-debug-visualizer/extension at master · hediet/vscode-debug-visualizer
2020 · github.com · its alternatives →
- 8

Write down your algorithm to be visualized
2016 · jasonpark.me · its alternatives →
- 9
 ADS-B visualizer▲339
I've created a web app for querying and visualization of ADS-B datasets: https://adsb.exposed/ Source code: https://github.com/ClickHouse/adsb.exposed/ The results significantly exceeded my expectations because the pictures are insanely beautiful, and the data is a treasure trove. It proves many statements that were not certain: - it is feasible to generate tiles by aggregation on a pixel level (instead of hexagons or rectangular grid); - it does not require JPG/PNG tiles - we can transfer raw bitmap data with zstd compression; - it is possible to…
2024 · adsb.exposed · its alternatives →
- 10GP
2016 · veniversum.github.io · its alternatives →
- 11

Yet Another Compiler Visualizer. Contribute to ashutoshbsathe/yacv development by creating an account on GitHub.
2021 · github.com · its alternatives →
- 12VF
Systemizer is a system design tool that allows you to simulate systems. Create and simulate your system with many customizable components.
2021 · honzaap.github.io · its alternatives →
- 13GR
I built this as part of my quest to properly learn data visualization. The code is the easy part! Some lessons learned: - personal verification of the the general truth that pie charts are tough! and the returns are not great for the effort due to people's difficulties perceiving angles - may not use "vanilla" d3 with no React. was difficult to adapt for mobile - the GitHub API provides fairly standardized responses so building dynamic charts wasn't too bad. But when working with streaming data (say Kafka) I can see this getting interesting... schema registry should help but creating a view…
2024 · see-my-repo.netlify.app · its alternatives →
- 14

- 15

Hi HN! I've found this visualization tool immensely helpful over the years for getting an intuition for how an LLM "sees" some piece of text, and with a bit of elbow grease decided to move all compute to client side so I could make it publicly available. I've found it particularly useful for - Understanding exactly how repetition and patterns affect a small LM's ability to predict correctly - Understanding different tokenization patterns and how it affects model output - Getting a general sense of how "hard" different prediction tasks are for GPT-style models Known problems (that I probably…
2023 · perplexity.vercel.app · its alternatives →
- 16

Make drawing and labeling bounding boxes a piece of cake - shoumikchow/bbox-visualizer
2020 · github.com · its alternatives →
- 17IF
2015 · david-peter.de · its alternatives →
- 18
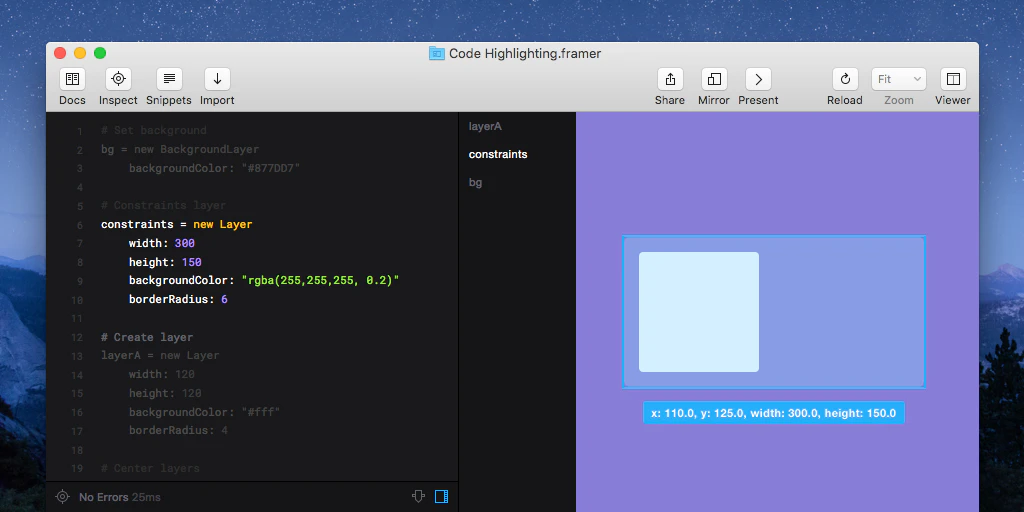
A new way to inspect and navigate your prototyping code
2015 · its alternatives →
- 19OC
2012 · assembly.ynh.io · its alternatives →
- 20

AI rendering tool to create realistic visualizations
2024 · visualizee.ai · its alternatives →
- 21

Creating data visualizations with AI nowadays often means chat, chat and more chats...and writing long prompts can be annoying while they are also not the most effective way to describe your visualization designs. Data Formulator blends UI interaction with natural language so that you can create visualizations with AI much more effectively! You can: * create rich visualizations beyond initial datasets, where AI helps transforming and visualizing data along the way * iterate your designs and dive deeper using data threads, a new way to manage your conversation with AI. Here is a demo video:…
2024 · github.com · its alternatives →
- 22

- 23

Visualize your colors on real designs for better experience
2024 · colors-visualizer.vercel.app · its alternatives →
- 24

Make your project alive with colorful scenes
2021 · manufactory.craftwork.design · its alternatives →
Also compare
- Factorio Blueprint Visualizer alternatives
- Framer Design alternatives
- Pts.js – A library for visualization and creative coding alternatives
- Graphite, a Blender-inspired 2D procedural design Rust app alternatives
- Framer alternatives
- Microsoft releases Flint, a visualization language for AI agents alternatives
Ranked by how close each launch is in meaning, then by votes. Prices were read from each product’s own site when checked and can change. Refine with your own description →