Dev tools · alternatives · 2026

24 alternatives to Geospatial Data Visualization Engine
LargeScale WebGLPowered Geospatial Data Visualization Engine
Below are 24 products that do a similar job, ranked by how close each is in meaning and then by launch-day votes. Prices are shown for the 2 we have checked on their own sites, 2 of them free or with a free tier. Geospatial Data Visualization Engine launched in 2019; newer entries below may have overtaken it.
Only the free ones: free alternatives to Geospatial Data Visualization Engine →
- 1

Globe wireframe visualizations in Golang.
2017 · github.com · its alternatives →
- 2

A framework for 3D geospatial visualization in the browser
2016 · github.com · its alternatives →
- 3
 Vizzu▲223
Vizzu is a data visualization platform built on a C++ charting engine running on WebAssembly.
2022 · vizzu.io · its alternatives →
- 4TL
Tableau-Like Data Visualizations in JavaScript is a charting library launched in 2018 that enables developers to create interactive data visualizations similar to Tableau.
2018 · charts.com · its alternatives →
- 5
 ADS-B visualizer▲339
ADS-B visualizer is a web application for querying and exploring aircraft tracking data collected through ADS-B signals.
2024 · adsb.exposed · its alternatives →
- 6
 vizGPTfree tier, from $10/mo▲80
Make contextual data visualization with Chat interface
2023 · vizgpt.ai · its alternatives →
- 7
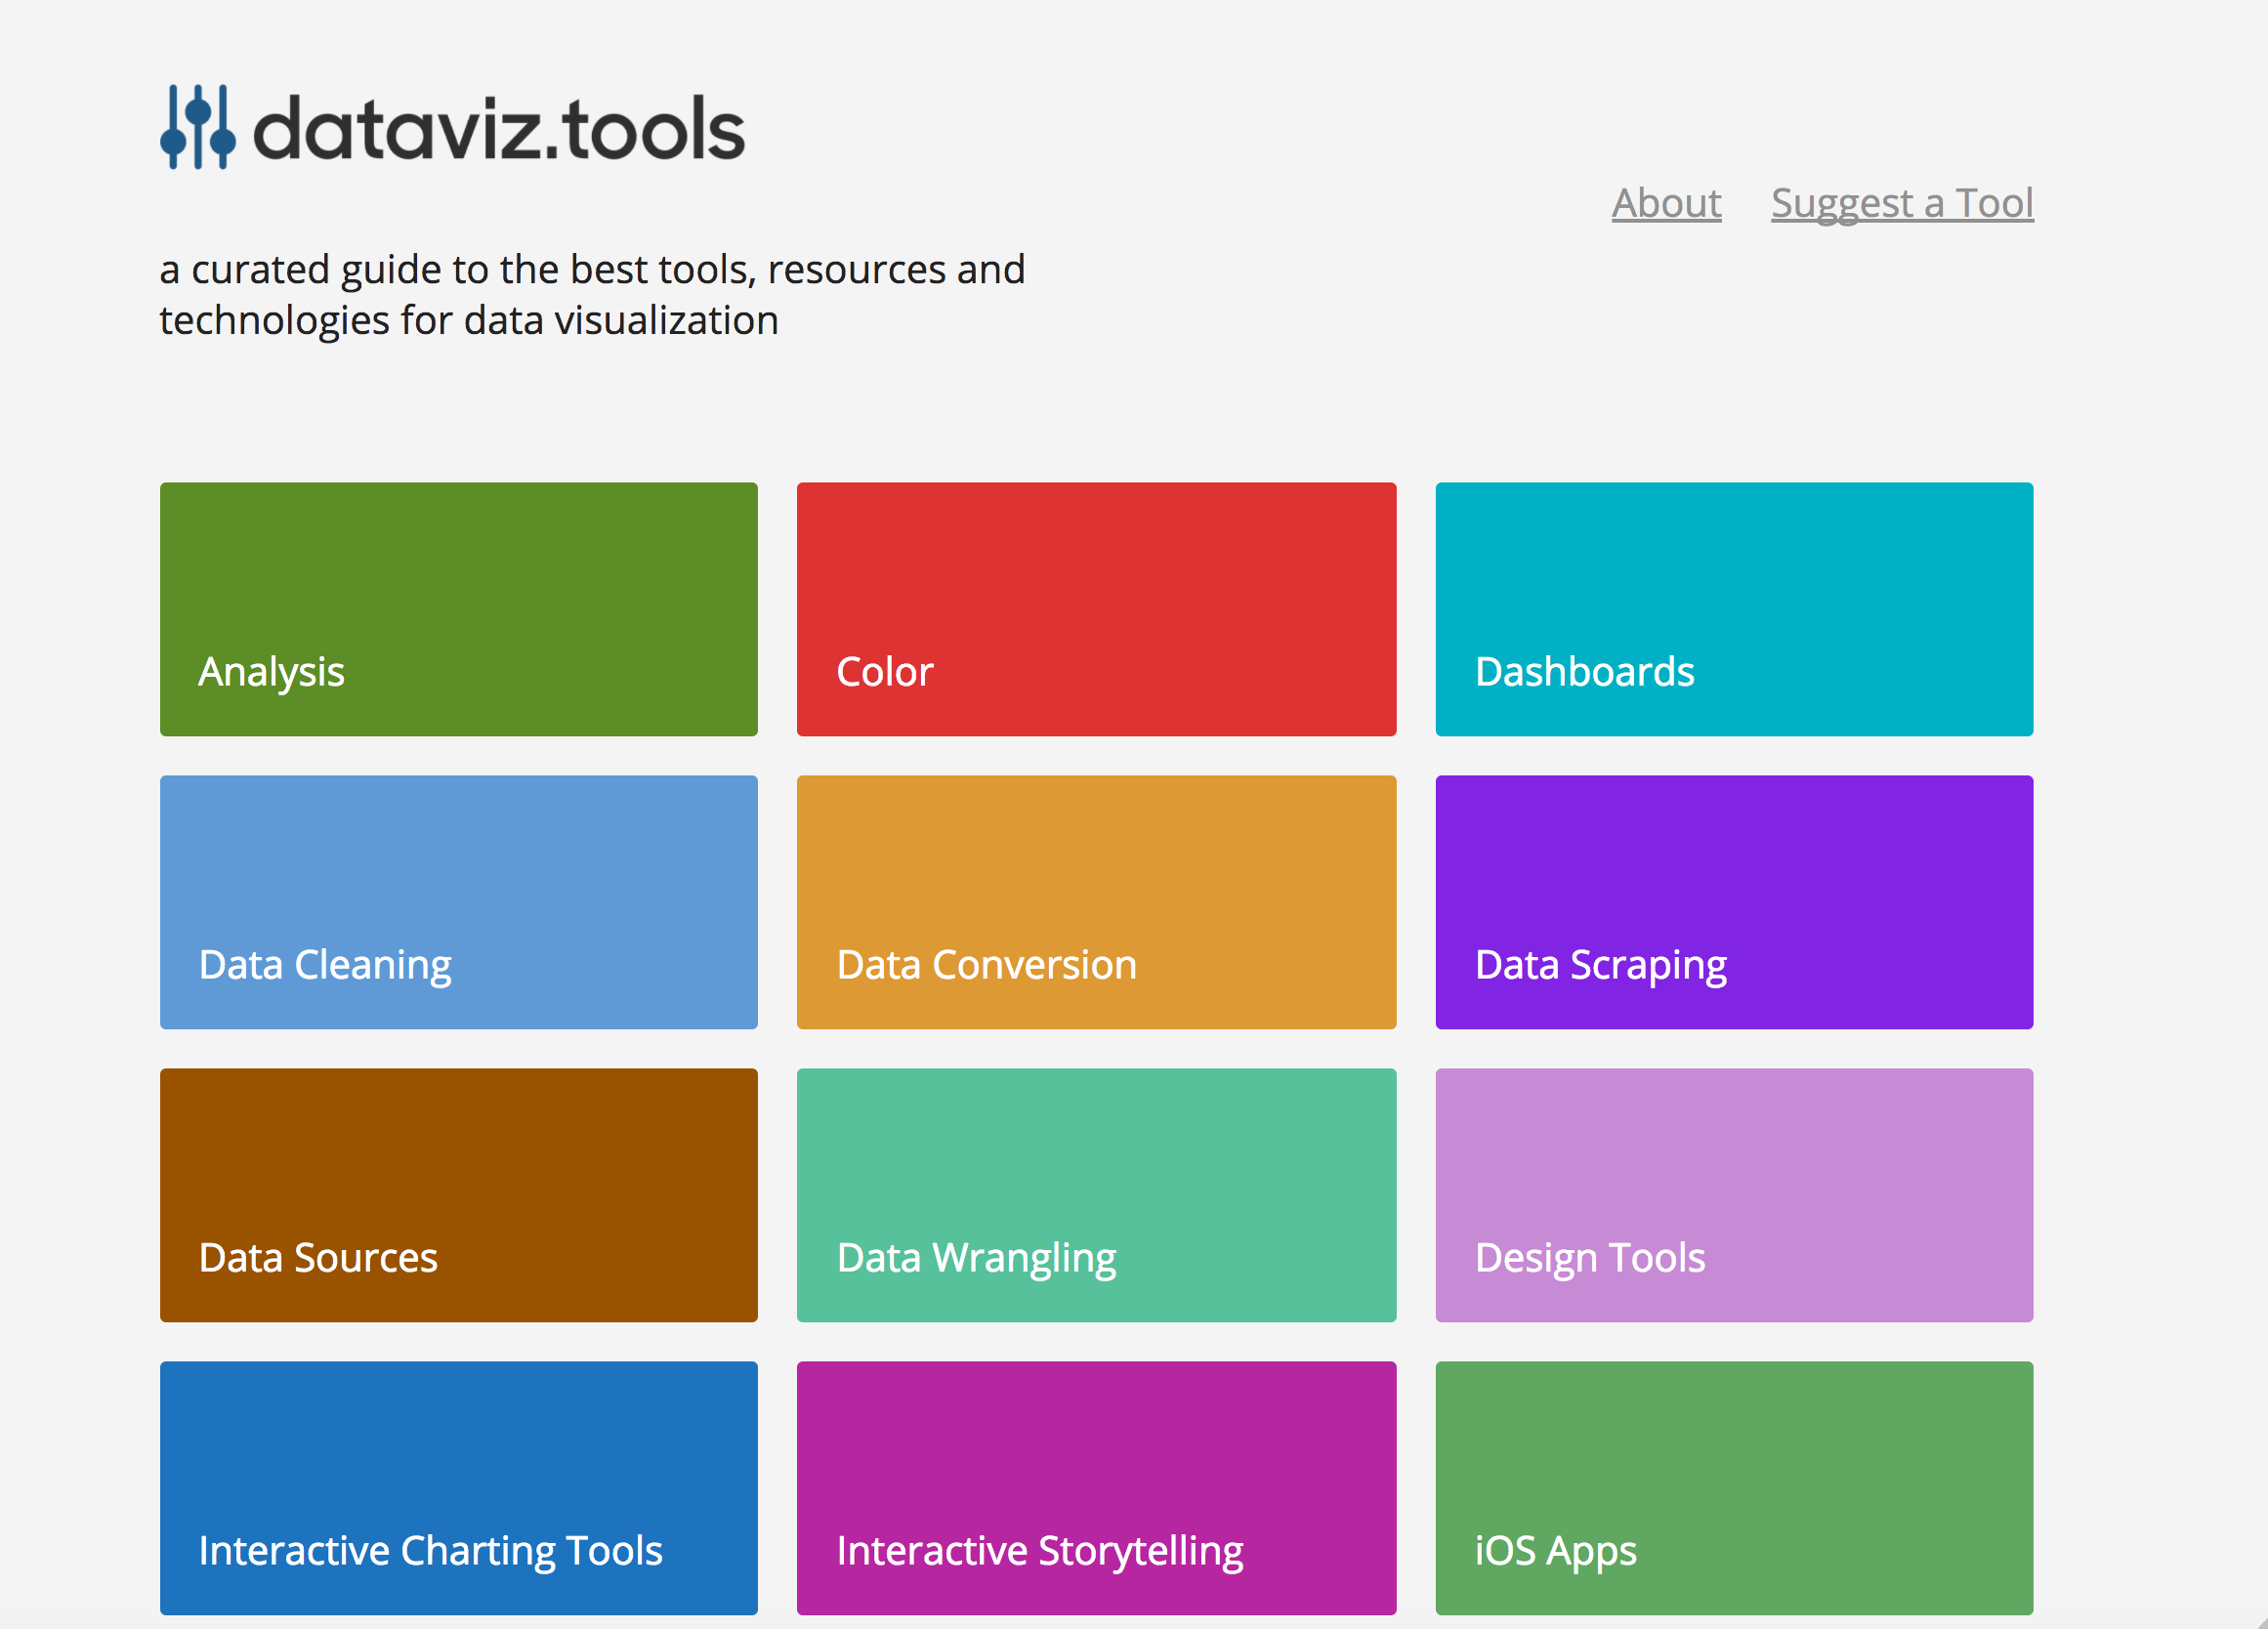 dataviz.tools▲409
Curated collection of the 400 best data visualization tools
2017 · dataviz.tools · its alternatives →
- 8
 Data Formulatorfree▲212
Creating data visualizations with AI nowadays often means chat, chat and more chats...and writing long prompts can be annoying while they are also not the most effective way to describe your visualization designs. Data Formulator blends UI interaction with natural language so that you can create visualizations with AI much more effectively! You can: * create rich visualizations beyond initial datasets, where AI helps transforming and visualizing data along the way * iterate your designs and dive deeper using data threads, a new way to manage your conversation with AI. Here is a demo video:…
2024 · github.com · its alternatives →
- 9

- 10

Rendering One Million Datapoints with D3 and WebGL is a technical resource for developers working with large datasets.
2020 · blog.scottlogic.com · its alternatives →
- 11
 Gio.js▲77
🌏 A Declarative 3D Globe Data Visualization Library built with Three.js
2018 · github.com · its alternatives →
- 12

- 13Ggrafar▲212
grafar is a JavaScript library for creating visualizations on the web, with 3D support via WebGL. Built for mathematical plotting, but also can also handle data visualization.
2021 · thoughtspile.github.io · its alternatives →
- 14

- 15
 kepler.gl▲116
Uber's geospatial analysis tool for large-scale data sets
2018 · kepler.gl · its alternatives →
- 16

Write down your algorithm to be visualized
2016 · jasonpark.me · its alternatives →
- 17
 heatmap.js▲132
An easy to use, open source, data visualization library to help you create beautiful heatmaps for your projects
2014 · patrick-wied.at · its alternatives →
- 18

Charts and infographics constructor in Figma
2021 · store.123d.one · its alternatives →
- 19

- 20VM
Topological visualizations for the masses
2020 · topovis.iambeef.com · its alternatives →
- 21FT
Fourier Transform Visualized via WebGL is an interactive tool that displays how Fourier transforms work through animated graphics.
2021 · static.laszlokorte.de · its alternatives →
- 22G3
Global 3D Topography Explorer is a web application that generates interactive 3D models of real-world locations using land cover and elevation data.
2025 · topography.jessekv.com · its alternatives →
- 23

- 24FW
First WebGL App is a browser-based visualization tool that uses NOAA data to display historical storm paths dating back to 1848.
2012 · callum.com · its alternatives →
Also compare
Ranked by how close each launch is in meaning, then by votes. Prices were read from each product’s own site when checked and can change. Refine with your own description →