Life & fun · alternatives · 2026

24 alternatives to Graphs
Data Visualization meets Daily Web Puzzle
Below are 24 products that do a similar job, ranked by how close each is in meaning and then by launch-day votes. Graphs launched in 2024; newer entries below may have overtaken it.
- 1GA
Hi everyone! Graphs is the intersection of data visualization and the daily web puzzle genre (Wordle, NYT Mini Crossword, Connections, etc.). Every day, you are given a nameless graph and 5 options to select the right dataset it is representing. Upon winning, you can access the underlying dataset and other info + maintain a streak and stats. It's super simple - check out today's chart and you should be able to get the gist quickly. My email + twitter account (@graphsgame) is on the page, would love a feedback or a follow. Don't hesitate to reach out!
2024 · graphs.world · its alternatives →
- 2

Create pro-level graphs that drive actions
2024 · graphy.app · its alternatives →
- 3

Hello, HN! Figure is a little side project I’ve been working on. Someone described it as Bejeweled meets Wordle. I built the puzzle interface and website in Next.js and React, which was a first for me and overall a great learning experience. The daily puzzle data is queued up in a PostgreSQL table. Another table stores anonymous solve stats. Once a day, a cron job hits a serverless API that promotes the next puzzle as “live” and prompts Next.js to update the prebaked static site with the new data. The game state is managed with Redux and your stats are persisted to localStorage. Framer…
2022 · figure.game · its alternatives →
- 4

Many JS libraries exist to build graphs on the web (Vega, chartJS, Plotly...). They allow to make charts quickly. But you lose flexibility: you're limited by the options they offer. I just created a gallery with hundreds of graphs made with d3.js and React. - Examples are split by graph types - They all come with explanation and code sandboxes - Gradual complexity to ease the learning curve It took me ages to create this project! Feedback welcome!
2023 · react-graph-gallery.com · its alternatives →
- 5TL
2018 · charts.com · its alternatives →
- 6

- 7

A collection of composable React components for building interactive data visualizations - FormidableLabs/victory
2016 · github.com · its alternatives →
- 8

- 9

This is a simple graph database in SQLite, inspired by "SQLite as a document database" - dpapathanasiou/simple-graph
2020 · github.com · its alternatives →
- 10DV
2017 · dvblogger.com · its alternatives →
- 11

Catalog of all chart types and tools to build them
2017 · visualizationuniverse.com · its alternatives →
- 12VG
2020 · treksit.netlify.app · its alternatives →
- 13

- 14

- 15AG
A daily visual guessing game drawn from this day in Wikipedia history.
2022 · doodleai.darraghoriordan.com · its alternatives →
- 16
 CalcGen AI▲123
Beautifully interactive data visualizations. One prompt.
2024 · welcome.calcgen.ai · its alternatives →
- 17
- 18

- 19

- 20
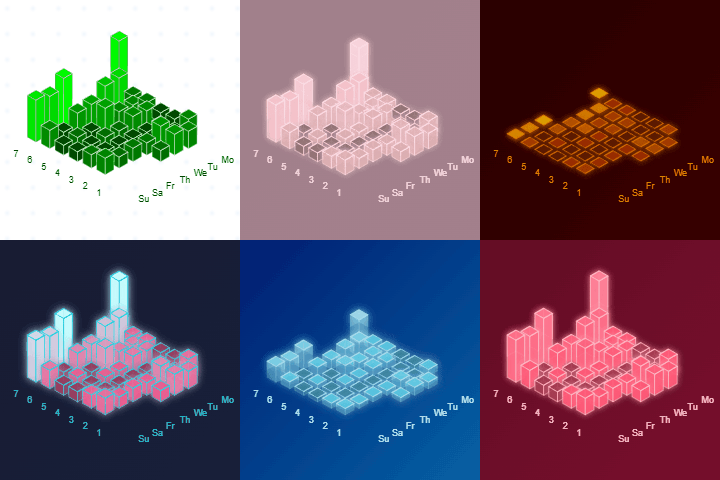
Visualize your weekly activity on Bluesky in a 3D chart
2025 · bluesky-3d-graph.vercel.app · its alternatives →
- 21
 ChartStud▲106
Turn messy data into clear decisions in minutes
Feb 2026 · chartstud.com · its alternatives →
- 22
 Vizician▲77
Drag & drop your data for instant visual data exploration
2022 · vizician.com · its alternatives →
- 23

- 24

Turn Tables Into Stunning Graphs-No Coding, Just Clarity!
2025 · its alternatives →
Also compare
Ranked by how close each launch is in meaning, then by votes. Prices were read from each product’s own site when checked and can change. Refine with your own description →