Commerce · alternatives · 2026

24 alternatives to Mentas
Live map of global commodity flows and chokepoints
Below are 24 products that do a similar job, ranked by how close each is in meaning and then by launch-day votes.
- 1

OP here: I created this visualization tool as the byproduct of a supply chain class I taught at Columbia. The pedagogical exercise grew into a full blown visualization and paper about global oil trade. The model: The mechanics are the same as the financial network Eisenberg-Noe: Instead of banks, every country consumes oil interconnected via bilateral trading. Shocks propagate throughout the network, depleting oil reserves when bottleneck nodes (such as the Strait of Hormuz) are blocked. Insights: The interesting part is the mechanics of how the crisis unfolds: for example, France receives 0…
Jul 2026 · globaloilnetwork.staffinganalytics.io · its alternatives →
- 2IH
I built this because I was interested in the data. Didn't fully get it to what I wanted, but thought I'd share it nonetheless. Maybe someone has better data sources they could share! Turns out live ship tracking APIs are expensive so I manually just copied the json from https://www.marinetraffic.com/en/ais/home/centerx:57.4/cente... I'll probably have an ai agent do the same thing on some cron interval, if this gets any fanfare. To actually know if the port is open without live ship tracking I found…
Apr 2026 · ishormuzopenyet.com · its alternatives →
- 3

The quickest and easiest territory mapping software that you ever used. Trusted by more than 1000 customers for data-driven decisions
2018 · oalley.net · its alternatives →
- 4MA
The concept for metiq.space came after playing Global Magnates with friends and realizing how fragmented live global data is. ships, aircraft, satellites, ports, weather, hazards, infrastructure, cyber, and public datasets all exist, but they usually live in separate tools and maps. The goal was to build one interactive 3D globe where live public data could be visualized by latitude, longitude, and altitude. Surface data stays on the globe, while aircraft, satellites, and other above surface things can be represented in actual 3D space instead of being flattened onto a map. The outcome is an…
Jun 2026 · metiq.space · its alternatives →
- 5

- 6

Interactive reference guide to the world
Mar 2026 · ryanshook.org · its alternatives →
- 7LW
Hi HN, I made a web game to practice country locations a while ago and HN liked it, so I thought I'd post my updated version as well. As for how the game works and feels, I'd really recommend you checking it out for yourself, it's free, no signup, no ads. The tech stack is Vue + ts + Tailwind/Daisy for the looks. The learning algorithm is a slight modification of the ts version of FSRS. If you have anything to add, it's open source as well (https://github.com/koljapluemer/learn-worldmap), although not well documented yet. In the end it's just a little sideproject,…
2025 · map.koljapluemer.com · its alternatives →
- 8
 Market Map▲108
Explore the universe of publicly traded companies
2023 · marketmap.one · its alternatives →
- 9
 Grain▲139
Map user journeys in real time and tune with remote config
Oct 2025 · grainql.com · its alternatives →
- 10

Journey through/over/across the world wide web by Quartz
2016 · qz.com · its alternatives →
- 11
 Mentum▲123
Easiest way to offer wealth-creation services to your users
2021 · getmentum.com · its alternatives →
- 12
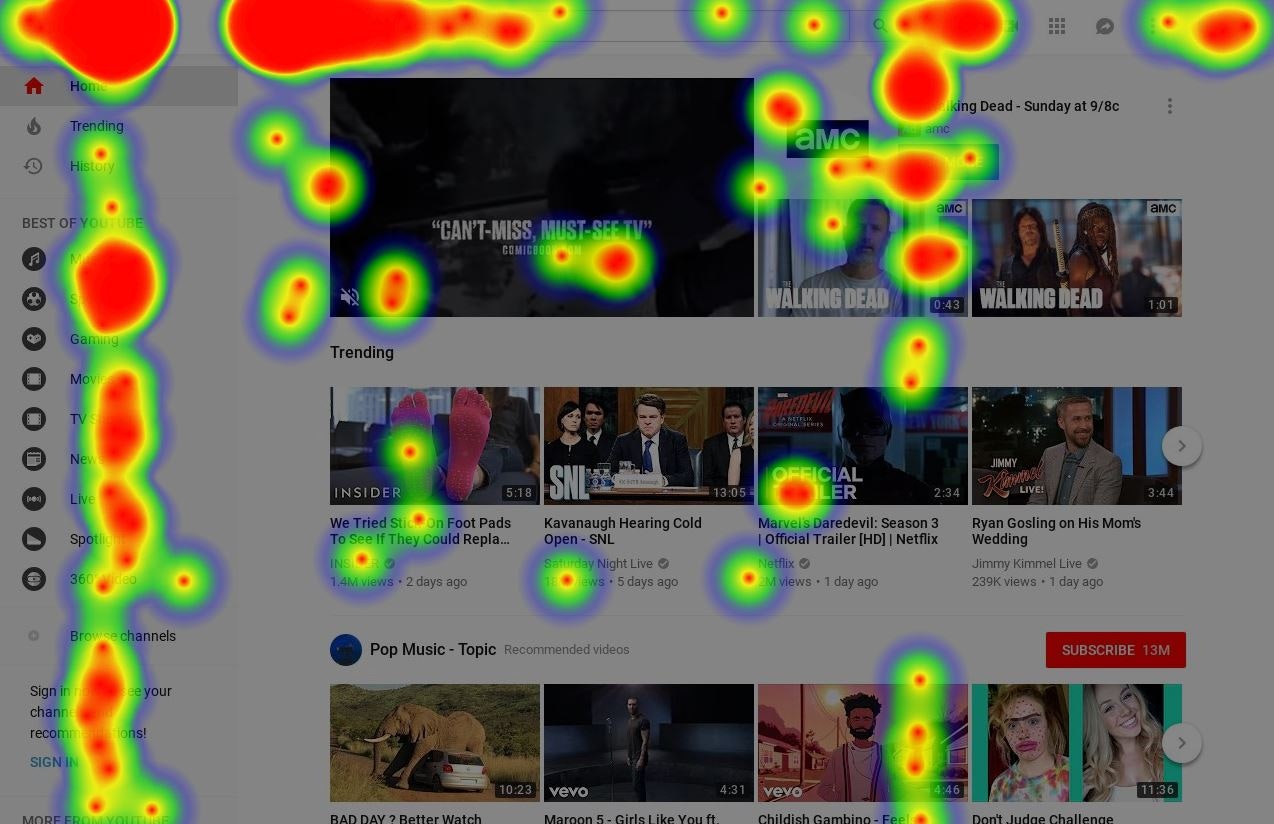
Any website's heatmap data is at your fingertips
2018 · its alternatives →
- 13

An interactive map of where the world breaks
Apr 2026 · ekoa.github.io · its alternatives →
- 14IE
2017 · mjmdavis.com · its alternatives →
- 15TT
Simulate anything on a map from a text prompt -- and conduct risk analysis against LiveUA map's global realtime data points from social media and news sources. I trained a GPT-2-size model on historical incident data used to predict things that will go wrong. As historian Benjamin Breen mentions, the leading language models are good historians, so the application will simulate historical events pretty well also. I include a Multi-Agent RL Urban Mobility model in progress displayed on the map as small white cubes representing traffic and pedestrians. Around SF, it uses real census data and…
2025 · mused.com · its alternatives →
- 16

Understand the footprint of Tableau in Asia
2015 · analysepodcast.com · its alternatives →
- 17

- 18

Real-time crude oil prices and data
2025 · commoditieschart.net · its alternatives →
- 19TC
Hello, I wanted to share with you all a interactive map of the economics and physics constraints of the AI buildout. It has macro drivers, industrial chokepoints, and where that shows up in markets. I've added 393 nodes and 562 edges to capture other supply / physics constraints as well. There's no sign up, and no pay wall, it's all free. Please let me know what you think!
Jun 2026 · atomprophet.io · its alternatives →
- 20M1
2018 · geonames.tile38.com · its alternatives →
- 21

Better market clarity, faster. A 3D map of how money flows
Dec 2025 · moneytrail.ai · its alternatives →
- 22

I've been working on GeoTraceroute for a while and just shipped v2.3 with submarine cable inference. A few things that might interest HN: - 320 community-contributed nodes across 50 countries, all volunteer-run - Three views: 3D globe with day/night rendering, 2D map, and a topological mode that infers submarine cable routing - The submarine cable inference is the part I find most interesting. Since cable routers don't respond to ICMP, the underwater segments are invisible to standard traceroute. The tool detects ocean crossings by geolocation delta between consecutive hops, then infers…
Apr 2026 · geotraceroute.com · its alternatives →
- 23LB
I built this over the weekend. Any feedback is appreciated. Please note you will need a WebGL enabled browser. Thank you for checking it out. --UPDATE-- HN Traffic is strangling earthbit. There is sporadic downtime due to the web services I am using, if no transactions appear after a few seconds, then please try again in an hour.
2013 · earthbit.net · its alternatives →
- 24

Create slick reports from World Bank data using charts, heatmaps, and tables.
2017 · worldoscope.cxjs.io · its alternatives →
Also compare
- I simulated closing the Strait of Hormuz on real oil trade data alternatives
- Is Hormuz open yet? alternatives
- A map that shows you how far you can go for a given time or distance alternatives
- Metiq: a real time 3D globe for 100 public datasets alternatives
- Atlas alternatives
- Global Maritime Chokepoints alternatives
Ranked by how close each launch is in meaning, then by votes. Prices were read from each product’s own site when checked and can change. Refine with your own description →