Life & fun · alternatives · 2026

24 alternatives to Worldoscope – Create slick reports from World Bank data
Create slick reports from World Bank data using charts, heatmaps, and tables.
Worldoscope is a tool for creating reports using World Bank data. It presents information through charts, heatmaps, and tables, allowing users to visualize global economic and development statistics. The tool is… Below are 24 products that do a similar job, ranked by how close each is in meaning and then by launch-day votes. Worldoscope – Create slick reports from World Bank data launched in 2017; newer entries below may have overtaken it.
- 1

2021 · weatherspark.com · its alternatives →
- 2

Google's new tool turns boring data into GIFs!
2017 · datagifmaker.withgoogle.com · its alternatives →
- 3
 DataMonkey▲676
Your GeoAI to combine in-house with public map-based data
2024 · datamonkey.tech · its alternatives →
- 4

- 5

- 6

- 7

- 8
 Crowdoscope▲74
A research tool for real-time collective intelligence.
2018 · crowdoscope.com · its alternatives →
- 9
 HackerMetrics▲322
Turn your Google Analytics into beautiful reports
2017 · hackermetrics.com · its alternatives →
- 10

:snake: :bar_chart: :chart_with_upwards_trend: Build complex dashboards without any front-end code. Use your own endpoints. JSON config only. Ready to go. - GitHub - christabor/flask_jsondash: :snake: :chart_with_upwards_trend: Build complex dashboards without any front-end code. Use your own endpoi
2016 · github.com · its alternatives →
- 11

Explore global weather forecasts on interactive maps with temperature, wind, and precipitation overlays. 16-day outlooks for cities worldwide, powered by NOAA GFS.
2014 · weather-explorer.com · its alternatives →
- 12

MapHub allows you to create, share and collaborate interactive maps online.
2016 · maphub.net · its alternatives →
- 13
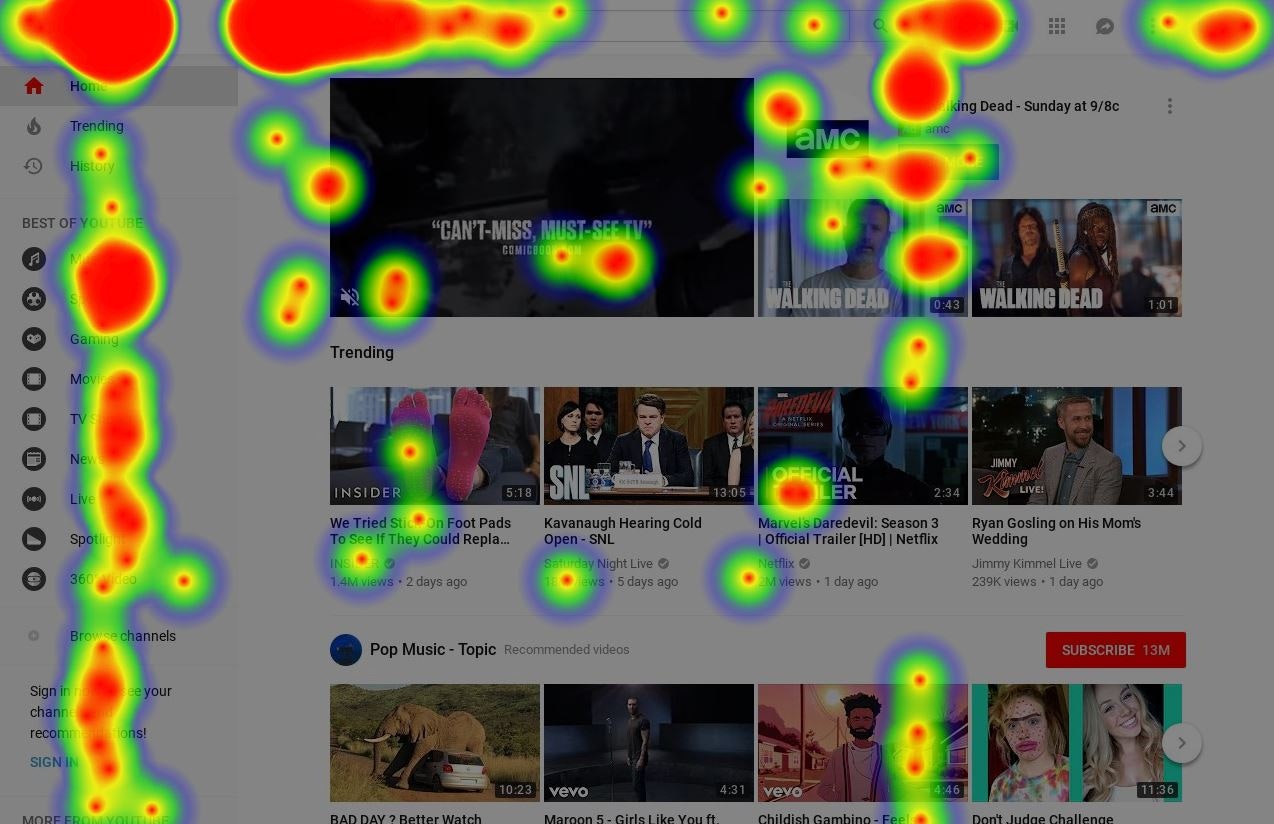
Any website's heatmap data is at your fingertips
2018 · its alternatives →
- 14

Responsive HTML5 charts with 10x performance
2017 · canvasjs.com · its alternatives →
- 15WP
2014 · roadtolarissa.com · its alternatives →
- 16
 ChartBrick▲120
Create charts using your databases from Notion or Airtable
2022 · chartbrick.com · its alternatives →
- 17
 Gio.js▲77
3D globe info visualization library built with Three.js
2018 · github.com · its alternatives →
- 18AW
Global Temperature Change WebGL</i> is an experiment that tries to illustrate how global temperatures on earth have changed between 1850 and 2016.
2016 · callumprentice.github.io · its alternatives →
- 19DA
Dear HN, I am Riwaj, the cofounder of dstack.ai (https://github.com/dstackai). A few months ago, we built an online service that allows users to publish data visualizations from Python or R. The idea was to build a tool that did not require additional programming or front-end development for publishing data visualizations. Such a code can be invoked from either Jupyter notebook, RMarkdown, Python, or R scripts. Once the data is pushed, it can be accessed via a browser. Open-sourcing dstack: During our customer discovery phase, we realized that dstack.ai should integrate a lot…
2020 · its alternatives →
- 20

- 21

:bar_chart: :clipboard: Dashboards using YAML or JSON files - GitHub - kantord/just-dashboard: :bar_chart: Dashboards using YAML or JSON files
2018 · github.com · its alternatives →
- 22MMapipedia▲61
A web platform I've written to make it easy for people to share goespatial time series data and display it on animated heatmaps. There's also a social media component that allows you to write comments, follow, share and like data sets that you want to engage with. You can also download the CSV data and embed animations into your own websites. People uploading datasets can also choose to make money by accepting donations. Please check out the home page for more details: https://mapipedia.com Here are some samples of things created with the platform (press the play button to start…
2019 · its alternatives →
- 23VO
vizzu - Library for animated data visualizations and data stories
2021 · lib.vizzuhq.com · its alternatives →
- 24

Visualize 100+ world indicators across 200+ countries
2025 · globydata.xyz · its alternatives →
Also compare
Ranked by how close each launch is in meaning, then by votes. Prices were read from each product’s own site when checked and can change. Refine with your own description →