Life & fun · September 12, 2016
A WebGL visualization to show how global temperature changed since 1850
Global Temperature Change WebGL</i> is an experiment that tries to illustrate how global temperatures on earth have changed between 1850 and 2016.
A WebGL visualization to show how global temperature changed since 1850 launched on September 12, 2016 with 69 votes, #765 of 3,744 launches that month and more than 90% of that year's launches. The site was still online in September 2026, 10 years on.
In plain words
Global Temperature Change WebGL is an interactive visualization tool that displays how global temperatures have shifted from 1850 to 2016. Built with WebGL technology, it presents historical temperature data in a visual format designed to help users understand long-term climate patterns. The tool is intended for anyone interested in exploring climate science and observing temperature trends across more than 150 years of recorded data.
written from the facts on this page · September 2026
Does a similar job
all alternatives →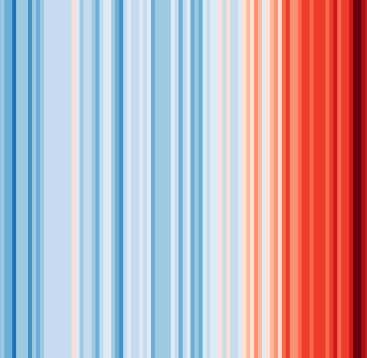 #ShowYourStripes2019 · showyourstripes.info · ▲140
Visualize 100+ years of climate change where you live ❄️🌎🔥
- FWFirst WebGL app. Uses NOAA data to visualize storm paths back to 1848.2012 · callum.com · ▲55
- P3Plotting 3 years of hourly data in 150ms2020 · leeoniya.github.io · ▲785
- 4Y41 years sea surface temperature anomaliesApr 2026 · ssta.willhelps.org · ▲147
- FTFourier Transform Visualized via WebGL2021 · static.laszlokorte.de · ▲175
- RTReal-Time 3D Gaussian Splatting in WebGL2023 · antimatter15.com · ▲309
More life & fun this month
the category →
A free city-building game in your browser. You are the mayor. You know what the city needs. Now get it past the zoning board, the neighbors, the appeals court and the next election.
Life & fun · 1d ago · permit.petercai.com
- IV
Life & fun · 13d ago · tanzaniaeducationproject.org

Turn a phone, tablet or TV into a sign. Type a message and it fills the screen: welcome signs, timers, Wi-Fi passwords and more. No app, no account, free.
Life & fun · 14d ago · bigwords.page

Play a free virtual guitar online with your keyboard or by touch. Slow songs down and see every chord, string and strum. Acoustic, classic, electric and bass.
Life & fun · 8d ago · guitoro.com

Carrier settings from iPhone, Pixel and Galaxy firmware, decoded and compared: APNs, VoLTE, 5G and Wi-Fi Calling per carrier, and what each build changed.
Life & fun · 12d ago · carrierexplode.com

Life & fun · 22d ago · space.bl2.net
Source: Show HN post ↗
Launched alongside, September 2016
the whole month → Startup Pitch Decks▲2,318
Real decks from real startups that raised over $400M
Growth · 2016 · cirrusinsight.com

Bitmap & tilemap generation from a single example with the help of ideas from quantum mechanics - mxgmn/WaveFunctionCollapse
Life & fun · 2016 · github.com


Reproducing images with geometric primitives. Contribute to fogleman/primitive development by creating an account on GitHub.
Dev tools · 2016 · github.com

 AccessURL▲818
Share access to accounts without sending a username/password
Life & fun · 2016 · accessurl.com