Dev tools · alternatives · 2026

24 alternatives to Narrative Chart
Let your charts tell stories with a few lines!
Below are 24 products that do a similar job, ranked by how close each is in meaning and then by launch-day votes. Prices are shown for the 5 we have checked on their own sites, 5 of them free or with a free tier. Narrative Chart launched in 2022; newer entries below may have overtaken it.
Only the free ones: free alternatives to Narrative Chart →
- 1
 Graphy for Data Storytellingfree tier, from $16/mo▲759
Create pro-level graphs that drive actions
2024 · graphy.app · its alternatives →
- 2

- 3

- 4VVizzu▲115
vizzu - Library for animated data visualizations and data stories
2021 · lib.vizzuhq.com · its alternatives →
- 5

Catalog of all chart types and tools to build them
2017 · visualizationuniverse.com · its alternatives →
- 6
 Mermaid Chartfree tier, from $10/mo▲176
A smarter way to create diagrams
2023 · mermaid.ai · its alternatives →
- 7

- 8

Data science notebooks turned into newsletters and tutorials
2021 · narrativetext.co · its alternatives →
- 9

Interactive charts and tables embedded into Notion.so pages
2020 · its alternatives →
- 10
 Chartbrew v2free tier, from $41/mo▲197
Visualize data from all your data sources in one place
2022 · chartbrew.com · its alternatives →
- 11

- 12TL
Tableau-Like Data Visualizations in JavaScript is a charting library launched in 2018 that enables developers to create interactive data visualizations similar to Tableau.
2018 · charts.com · its alternatives →
- 13

- 14

D3 TimelineChart is a visualization tool for creating timeline charts using the D3 library.
2016 · github.com · its alternatives →
- 15
- 16

- 17
 RankReel▲96
Create animated ranking charts from your data instantly
2024 · rankreel.app · its alternatives →
- 18

ChartDB is a tool that generates entity-relationship diagrams from database schemas using a single query, designed for developers and data analysts.
2024 · github.com · its alternatives →
- 19

Charts and infographics constructor in Figma
2021 · store.123d.one · its alternatives →
- 20

- 21
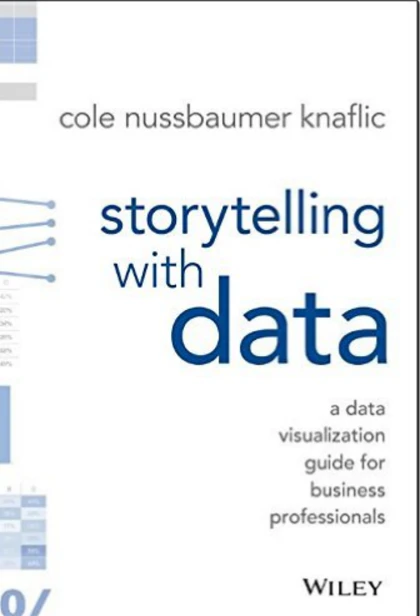
A data visualization guide for business professionals
2015 · amazon.com · its alternatives →
- 22

Reference tool for data visualisation
2016 · datavizcatalogue.com · its alternatives →
- 23
 Vizzu▲223
Vizzu is a data visualization platform built on a C++ charting engine running on WebAssembly.
2022 · vizzu.io · its alternatives →
- 24

Also compare
Ranked by how close each launch is in meaning, then by votes. Prices were read from each product’s own site when checked and can change. Refine with your own description →