Life & fun · alternatives · 2026

24 alternatives to Ocean Sensor Visualization Project
IoT visualizer for ocean measurement in coastal Georgia, US
Below are 24 products that do a similar job, ranked by how close each is in meaning and then by launch-day votes. Ocean Sensor Visualization Project launched in 2024; newer entries below may have overtaken it.
- 1
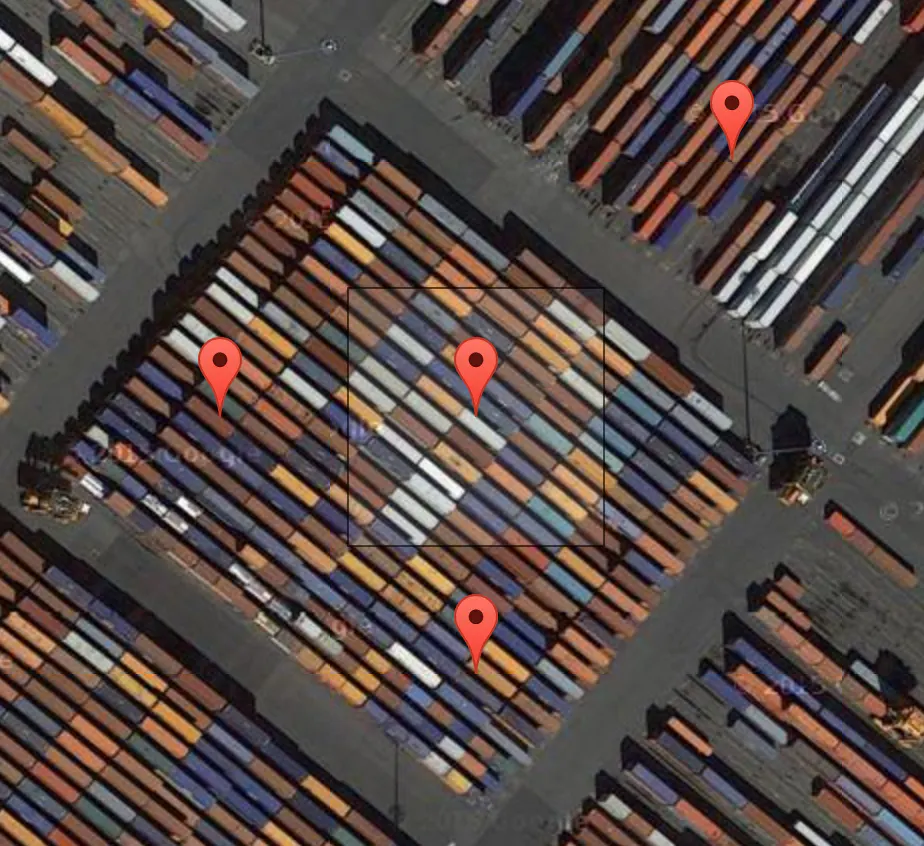 Terrapattern▲77
A visual search tool for satellite imagery
2016 · terrapattern.com · its alternatives →
- 2
 Telemetry Harbor▲125
Collect, analyze, and visualize IoT data with ease
2025 · harborscale.com · its alternatives →
- 3

Satellite imagery for dummies. Contribute to plant99/felicette development by creating an account on GitHub.
2020 · github.com · its alternatives →
- 4
Visualize Google location history data on a heatmap 🗺️
2018 · locationhistoryvisualizer.com · its alternatives →
- 5
- 6

GB Renewables Map an energy experiment created entirely in my free time (day job is visualisation at Octopus Energy). It's an interactive map showing live generation for major wind farms in Great Britain, showing what each wind farm is generating both now and in the past, and where that generation is physically located. Animated weather data is from WeatherLayers and shows current and historic wind conditions on the map, providing context to wind generation around the country. History mode allows you to go back in time and see wind generation and weather conditions for a particular date and…
2023 · renewables-map.robinhawkes.com · its alternatives →
- 7GI
Visualize your collected Google Location History data using an interactive heatmap directly in your browser.
2014 · theopolisme.github.io · its alternatives →
- 8

An open source Lora-based farm sensing and actuation network.
2019 · framagit.org · its alternatives →
- 9

- 10AI
This is an interactive map of US navigational aids and lighthouses, which indicates their location, color, characteristic and any remarks the Coast Guard has attached. I was sick at home with the flu this weekend, and went on a bit of a Wikipedia deep dive about active American lighthouses. Searching around a bit, it was very hard to find a single source or interactive map of active beacons, and a description of what the "characteristic" meant. The Coast Guard maintains a list of active lights though, that they publish annually…
Jan 2026 · lighthouses.app · its alternatives →
- 11
- 12

- 13FW
2012 · callum.com · its alternatives →
- 14

This is a service I've built to provide equirectangular cloud maps of the whole Earth, updated every 3 hours, for free. It's based on infrared and visible light data from EUMETSAT, processed to enhance the clouds and try to reduce the impact of surface temperatures on the final image. I built it because it's surprisingly hard to find these kinds of images in a format that's useful to developers and hobbyists. I was building a 3D ISS tracker and wanted to include live clouds but couldn't find anything good, so I got sidetracked, and here we are.
2023 · github.com · its alternatives →
- 15
 Flowmap.blue▲59
Flow map visualization for geographic movement analysis
2021 · flowmap.blue · its alternatives →
- 16

Hi HN, I built an OSINT tool called Weather2Geo that helps locate where a screenshot was taken based on the weather widget data visible (e.g. temp, condition, and local time in the taskbar). People often post these without realizing how specific those values can be in combination. It works by comparing the given weather condition, temperature, and time against current data from thousands of cities. It’s timezone-aware, supports fuzzy matching, and groups results geographically to reduce noise. It’s most effective on recent screenshots, ideally taken within the last hour—since weather and…
2025 · github.com · its alternatives →
- 17OV
2021 · app.openindoor.io · its alternatives →
- 18

2017 · naturalatlas.com · its alternatives →
- 19

2018 · gitlab.com · its alternatives →
- 20

Thermohaline Circulation and the Great Ocean Conveyor Belt
2017 · medium.com · its alternatives →
- 21
 Oceanir▲4
Find where any photo was taken — no GPS or metadata needed
Feb 2026 · oceanir.ai · its alternatives →
- 22GO
2013 · pndv.cumulonimbus.ca · its alternatives →
- 23

Queries live data from the Land/Ocean Biogeochemical Observatory sensors operating in the Indian River Lagoon. - stevenmhunt/lobo-irl
2016 · github.com · its alternatives →
- 24WR
2022 · docs.radar.chat · its alternatives →
Also compare
Ranked by how close each launch is in meaning, then by votes. Prices were read from each product’s own site when checked and can change. Refine with your own description →