Work · alternatives · 2026

24 alternatives to An interactive map showing live wind farm generation in Great Britain
GB Renewables Map an energy experiment created entirely in my free time (day job is visualisation at Octopus Energy). It's an interactive map showing live generation for major wind farms in Great Britain, showing what each wind farm is generating both now and in the past, and where that generation is physically located. Animated weather data is from WeatherLayers and shows current and historic wind conditions on the map, providing context to wind generation around the country. History mode allows you to go back in time and see wind generation and weather conditions for a particular date and…
GB Renewables Map is an interactive map displaying live and historical generation data from major wind farms across Great Britain. It overlays animated weather patterns to show wind conditions alongside generation… Below are 24 products that do a similar job, ranked by how close each is in meaning and then by launch-day votes. An interactive map showing live wind farm generation in Great Britain launched in 2023; newer entries below may have overtaken it.
- 1
 Electricity Map▲100
Live CO2 emissions of electricity consumption
2017 · electricitymaps.com · its alternatives →
- 2IB
This dashboard is a personal project I've developed to visualize every wind farm's energy production across Ireland. I'm trying to break into software development/data analytics sector and I wanted to build a project to practice my coding. I wanted to build a novel project rather than following along to a basic YouTube video project and not really learn anything. I'm interested in the renewable energy sector and after browsing the web noticed there isn't any public data on real time wind energy production in Ireland. I took the task onto myself to attempt to build a dashboard that…
2024 · irelandwinddashboard.com · its alternatives →
- 3HW
Plug-in solar panels (no electrician needed) have just become legal in the UK and will go on sale soon. Helios estimates how much electricity a typical installation could generate at a given address and what that's worth against your tariff. It uses UK government LIDAR data to reflect the actual skyline, so it knows whether there's a building or a hill blocking the sun. Caveats: - Outside LIDAR coverage (most of Scotland and Wales) it falls back to a synthetic horizon (less accurate). - Trees and recent developments (post-2022 or so) may not be in the data, and some address placements could…
May 2026 · helios.southlondonscientific.com · its alternatives →
- 4M1
🧧️【发财入口 6108.vip】🧧6️⃣BBIN·宝盈集团(中国)有限公司官网,因为目前BBIN宝盈已经拥有了十二个不同的语言版本,其原因就在BBIN宝盈注重会员资金安全和游戏的公平性,BBIN宝盈拥有超过二十个不同的资源分类,是最好的娱乐平台。
2019 · electricitytransition.com · its alternatives →
- 5

Last weekend, I tried creating an original visualization of something on many minds in my home country the Netherlands: land use. Much of our discussion revolves around land use—housing crisis, sustainable farming, solar energy—it's all about the land. To illustrate this, I created a map where each hexagon represents 0.06% (26,647 hectares) of land in the Netherlands. The color indicates the type of land use.
2024 · koenvangilst.nl · its alternatives →
- 6

2021 · weatherspark.com · its alternatives →
- 7

A hobby project of mine that was surprisingly easy to put together! I love waking up and seeing the freshly generated image.
2024 · github.com · its alternatives →
- 8

Explore global weather forecasts on interactive maps with temperature, wind, and precipitation overlays. 16-day outlooks for cities worldwide, powered by NOAA GFS.
2014 · weather-explorer.com · its alternatives →
- 9

Turn your spreadsheets into beautiful map visualizations
2024 · postcodeheatmap.com · its alternatives →
- 10AW
Global Temperature Change WebGL</i> is an experiment that tries to illustrate how global temperatures on earth have changed between 1850 and 2016.
2016 · callumprentice.github.io · its alternatives →
- 11
 Weather Lab▲177
Predicting cyclone paths & intensity 15 days ahead
2025 · accounts.google.com · its alternatives →
- 12

The UK MET office recently redesigned their site, adding a lot of additional whitespace, scrolling, and animations. This significantly reduced its usability for me, and left me wanting an ‘at a glance’ weather site. I made https://brolly.sh, a minimalist, plain text weather forecasting site. You can use it to view weather from around the world, with: 7 day forecast; Previous day log (so you can confirm it definitely was cooler / hotter / wetter / drier yesterday!); Hourly rain, wind, temperature, conditions; Hourly UV, air quality and pollen, including pollen type…
Jul 2026 · brolly.sh · its alternatives →
- 13

Last year I launched a website that allow people to see rainfall statistics that are based on satellite data. Historical rainfall information usually comes from rain gauges, and while these are fantastic there are many parts of the world that don't have many long term gauges, or where that data is hard to access. Satellite data can be an invaluable source of information for those data-scarce areas. The business model is to sell "extreme precipitation" data that can be used for flood modelling. Unfortunately, after a year I still haven't made a single sale. I've tried various ways of…
2023 · xrain.info · its alternatives →
- 14
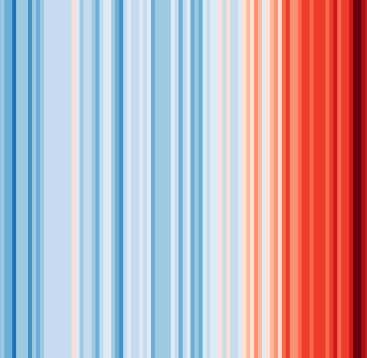 #ShowYourStripes▲140
Visualize 100+ years of climate change where you live ❄️🌎🔥
2019 · showyourstripes.info · its alternatives →
- 15

Explore the ERCOT power grid live: real-time system demand across the eight Texas weather zones, generation by fuel, 5-minute locational marginal prices (LMP) at settlement-point nodes, wind and solar output, transmission lines, and substations across the Texas Interconnection. Ask the agent anythin
Jul 2026 · askthegrid.com · its alternatives →
- 16IB
Hi all, I am not an expert in nuclear energy but I've always wondered and found it difficult to get a clear picture about the amount of nuclear stations located in a specific region. So I built this tool that shows all the nuclear plants in the world, scaled by their capacity and with indication of their status. Clustering is enabled by default and allows to see the sum potential capacity of a region. It's a fun tool for me: e.g. disable clustering, scale circle radius to 70%, go to EU, and you'll see Germany has shutdown all of the stations. Ofc it's a widely known fact, but what came to my…
2024 · nuclearstations.com · its alternatives →
- 17UW
2013 · uk.temperature.at · its alternatives →
- 18

Generate visual sitemap from any website. Just write URL
2020 · octopus.do · its alternatives →
- 19GI
Visualize your collected Google Location History data using an interactive heatmap directly in your browser.
2014 · theopolisme.github.io · its alternatives →
- 20G3
I made a web app to generate 3D models of real places on earth from land cover and elevation data. Click anywhere on the map to get a polygon, and then click "generate". It should work at most scales, but if your watershed or region selection is too large, the result can be less exciting because it's so flat. As a warning, the 3D models can sometimes be too much for my phone. It's nicer on desktop. I'm still working better on mobile support. The land cover data I'm using gives a cool effect, but at some point I'd like to add in global imagery and clouds. The backend is a Python thread…
2025 · topography.jessekv.com · its alternatives →
- 21

A global map of wind, weather, and ocean conditions
2020 · earth.nullschool.net · its alternatives →
- 22

Hi HN, I built an OSINT tool called Weather2Geo that helps locate where a screenshot was taken based on the weather widget data visible (e.g. temp, condition, and local time in the taskbar). People often post these without realizing how specific those values can be in combination. It works by comparing the given weather condition, temperature, and time against current data from thousands of cities. It’s timezone-aware, supports fuzzy matching, and groups results geographically to reduce noise. It’s most effective on recent screenshots, ideally taken within the last hour—since weather and…
2025 · github.com · its alternatives →
- 23SV
Hi HN, I wanted to share my team's side project! We like to do R&D projects and investigate new areas, interesting problems, etc. This application visualises the dynamic interplay between space weather and our terrestrial power grid, focusing on Geomagnetically Induced Currents (GICs) across the UK. By visualising the magnetic field, induced electric field, and resulting GICs, users can identify vulnerable areas of the UK power network and assess the potential for operational disruptions during geomagnetic storms. We would love to get some feedback and expand this to cover more power grids…
Dec 2025 · solarstorm.space · its alternatives →
- 24
 Zipcode Heat Map▲102
Generate heat maps of US states and counties from zip codes
2024 · zipcodeheatmap.com · its alternatives →
Also compare
- Electricity Map alternatives
- I built an interactive live wind farm dashboard for Ireland alternatives
- Helios – what plug-in solar could generate for any address in Britain alternatives
- Mapping 17 years of US electric generation alternatives
- I created this land use visualisation for the Netherlands alternatives
- A world map of 24x365 average temperature “fingerprints” alternatives
Ranked by how close each launch is in meaning, then by votes. Prices were read from each product’s own site when checked and can change. Refine with your own description →