AI · alternatives · 2026

24 alternatives to Ask the Grid
Explore the ERCOT power grid live: real-time system demand across the eight Texas weather zones, generation by fuel, 5-minute locational marginal prices (LMP) at settlement-point nodes, wind and solar output, transmission lines, and substations across the Texas Interconnection. Ask the agent anythin
Below are 24 products that do a similar job, ranked by how close each is in meaning and then by launch-day votes.
- 1

GB Renewables Map an energy experiment created entirely in my free time (day job is visualisation at Octopus Energy). It's an interactive map showing live generation for major wind farms in Great Britain, showing what each wind farm is generating both now and in the past, and where that generation is physically located. Animated weather data is from WeatherLayers and shows current and historic wind conditions on the map, providing context to wind generation around the country. History mode allows you to go back in time and see wind generation and weather conditions for a particular date and…
2023 · renewables-map.robinhawkes.com · its alternatives →
- 2
 Electricity Map▲100
Live CO2 emissions of electricity consumption
2017 · electricitymaps.com · its alternatives →
- 3

OP here: I created this visualization tool as the byproduct of a supply chain class I taught at Columbia. The pedagogical exercise grew into a full blown visualization and paper about global oil trade. The model: The mechanics are the same as the financial network Eisenberg-Noe: Instead of banks, every country consumes oil interconnected via bilateral trading. Shocks propagate throughout the network, depleting oil reserves when bottleneck nodes (such as the Strait of Hormuz) are blocked. Insights: The interesting part is the mechanics of how the crisis unfolds: for example, France receives 0…
Jul 2026 · globaloilnetwork.staffinganalytics.io · its alternatives →
- 4AS
2012 · nycpowerstatus.com · its alternatives →
- 5

- 6

- 7HW
Plug-in solar panels (no electrician needed) have just become legal in the UK and will go on sale soon. Helios estimates how much electricity a typical installation could generate at a given address and what that's worth against your tariff. It uses UK government LIDAR data to reflect the actual skyline, so it knows whether there's a building or a hill blocking the sun. Caveats: - Outside LIDAR coverage (most of Scotland and Wales) it falls back to a synthetic horizon (less accurate). - Trees and recent developments (post-2022 or so) may not be in the data, and some address placements could…
May 2026 · helios.southlondonscientific.com · its alternatives →
- 8

- 9
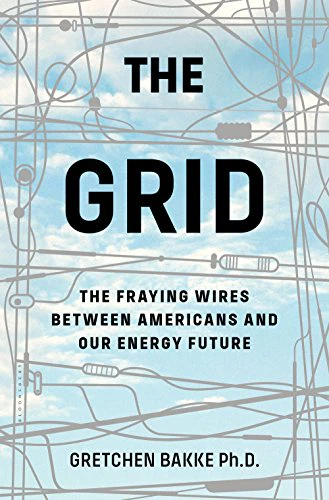 The Grid▲64
The fraying wires between Americans and our energy future
2016 · amazon.com · its alternatives →
- 10

Real time lightning strikes across the globe
2014 · lightningmaps.org · its alternatives →
- 11
 inBalance▲65
Electricity market forecasts; prices, solar, wind, and load
2021 · inbalanceresearch.com · its alternatives →
- 12SV
Hi HN, I wanted to share my team's side project! We like to do R&D projects and investigate new areas, interesting problems, etc. This application visualises the dynamic interplay between space weather and our terrestrial power grid, focusing on Geomagnetically Induced Currents (GICs) across the UK. By visualising the magnetic field, induced electric field, and resulting GICs, users can identify vulnerable areas of the UK power network and assess the potential for operational disruptions during geomagnetic storms. We would love to get some feedback and expand this to cover more power grids…
Dec 2025 · solarstorm.space · its alternatives →
- 13

Forecast and weather maps at a glance. (US only)
2015 · apps.apple.com · its alternatives →
- 14

Real-time energy data intelligence for Brazil's power grid
Mar 2026 · its alternatives →
- 15

Extract data from ISOs and other energy grid sources - gridstatus/gridstatus
2022 · github.com · its alternatives →
- 16
 Shift▲70
Shift electricity use to the least carbon intense grid times
2019 · shift.andrewpairman.com · its alternatives →
- 17

Hi HN, I am co-founder of Kickstage, a software company specializing in solutions for the electrical industry and lately grid operators. We are hiring engineers from different backgrounds, a lot of them software developers with limited experience in the sectors. Deep domain knowledge is key in our industry however, so we are constantly teaching the basics of power flow analysis, active vs reactive power, transmission line properties etc. With Jupyter notebooks and the Python console only, that's a tedious task and hardly ever led to a deep understanding of the topics. So we built BambooGrid:…
Jul 2026 · bamboo.kickstage.com · its alternatives →
- 18M1
🧧️【发财入口 6108.vip】🧧6️⃣BBIN·宝盈集团(中国)有限公司官网,因为目前BBIN宝盈已经拥有了十二个不同的语言版本,其原因就在BBIN宝盈注重会员资金安全和游戏的公平性,BBIN宝盈拥有超过二十个不同的资源分类,是最好的娱乐平台。
2019 · electricitytransition.com · its alternatives →
- 19

This is a service I've built to provide equirectangular cloud maps of the whole Earth, updated every 3 hours, for free. It's based on infrared and visible light data from EUMETSAT, processed to enhance the clouds and try to reduce the impact of surface temperatures on the final image. I built it because it's surprisingly hard to find these kinds of images in a format that's useful to developers and hobbyists. I was building a 3D ISS tracker and wanted to include live clouds but couldn't find anything good, so I got sidetracked, and here we are.
2023 · github.com · its alternatives →
- 20

Price, Trend, Interruption. All Spot Data, All in One Place
2025 · spot.cloudpilot.ai · its alternatives →
- 21

This was a lot of fun to build! I have an autistic son who is extremely interested in power lines, electrical transmission towers, and how the grid works. I decided to build a little game for him. When I finally showed it to him with bated breath, he rolled his eyes and said, “Is it 3D? I’ll only like it if it’s 3D!” So, I decided to polish it up and release it to the world! You get a 9x9 map with one power plant, three houses, and terrain obstacles, and the goal is to connect the power plant to the houses with an optimal path. Beneath the coat of paint, it’s a graph theory optimization…
Aug 2026 · wirespan.app · its alternatives →
- 22IB
This dashboard is a personal project I've developed to visualize every wind farm's energy production across Ireland. I'm trying to break into software development/data analytics sector and I wanted to build a project to practice my coding. I wanted to build a novel project rather than following along to a basic YouTube video project and not really learn anything. I'm interested in the renewable energy sector and after browsing the web noticed there isn't any public data on real time wind energy production in Ireland. I took the task onto myself to attempt to build a dashboard that…
2024 · irelandwinddashboard.com · its alternatives →
- 23

- 24

Browse open electrical-grid maps, datasets and capacity data for (almost) every country, state and province.
May 2026 · open-energy-transition.github.io · its alternatives →
Also compare
Ranked by how close each launch is in meaning, then by votes. Prices were read from each product’s own site when checked and can change. Refine with your own description →