Dev tools · alternatives · 2026

24 alternatives to Reflect Public Beta
Data visualization as a service
Reflect Public Beta is a data visualization service designed for developers and analysts who need to transform raw data into visual formats. The platform provides tools to create charts, graphs, and interactive… Below are 24 products that do a similar job, ranked by how close each is in meaning and then by launch-day votes. Reflect Public Beta launched in 2017; newer entries below may have overtaken it.
- 1GR
I built this as part of my quest to properly learn data visualization. The code is the easy part! Some lessons learned: - personal verification of the the general truth that pie charts are tough! and the returns are not great for the effort due to people's difficulties perceiving angles - may not use "vanilla" d3 with no React. was difficult to adapt for mobile - the GitHub API provides fairly standardized responses so building dynamic charts wasn't too bad. But when working with streaming data (say Kafka) I can see this getting interesting... schema registry should help but creating a view…
2024 · see-my-repo.netlify.app · its alternatives →
- 2
 Glazed▲867
Turn Figma files into production-ready tracking in minutes
2024 · glazedanalytics.com · its alternatives →
- 3

Simple, real-time, fun & lightweight web analytics solution
2023 · datapulse.app · its alternatives →
- 4

- 5TA
2015 · tonicdev.com · its alternatives →
- 6
 Morph Beta▲138
All-in-one data studio: AI-powered, real-time collaboration
2023 · morph-data.io · its alternatives →
- 7
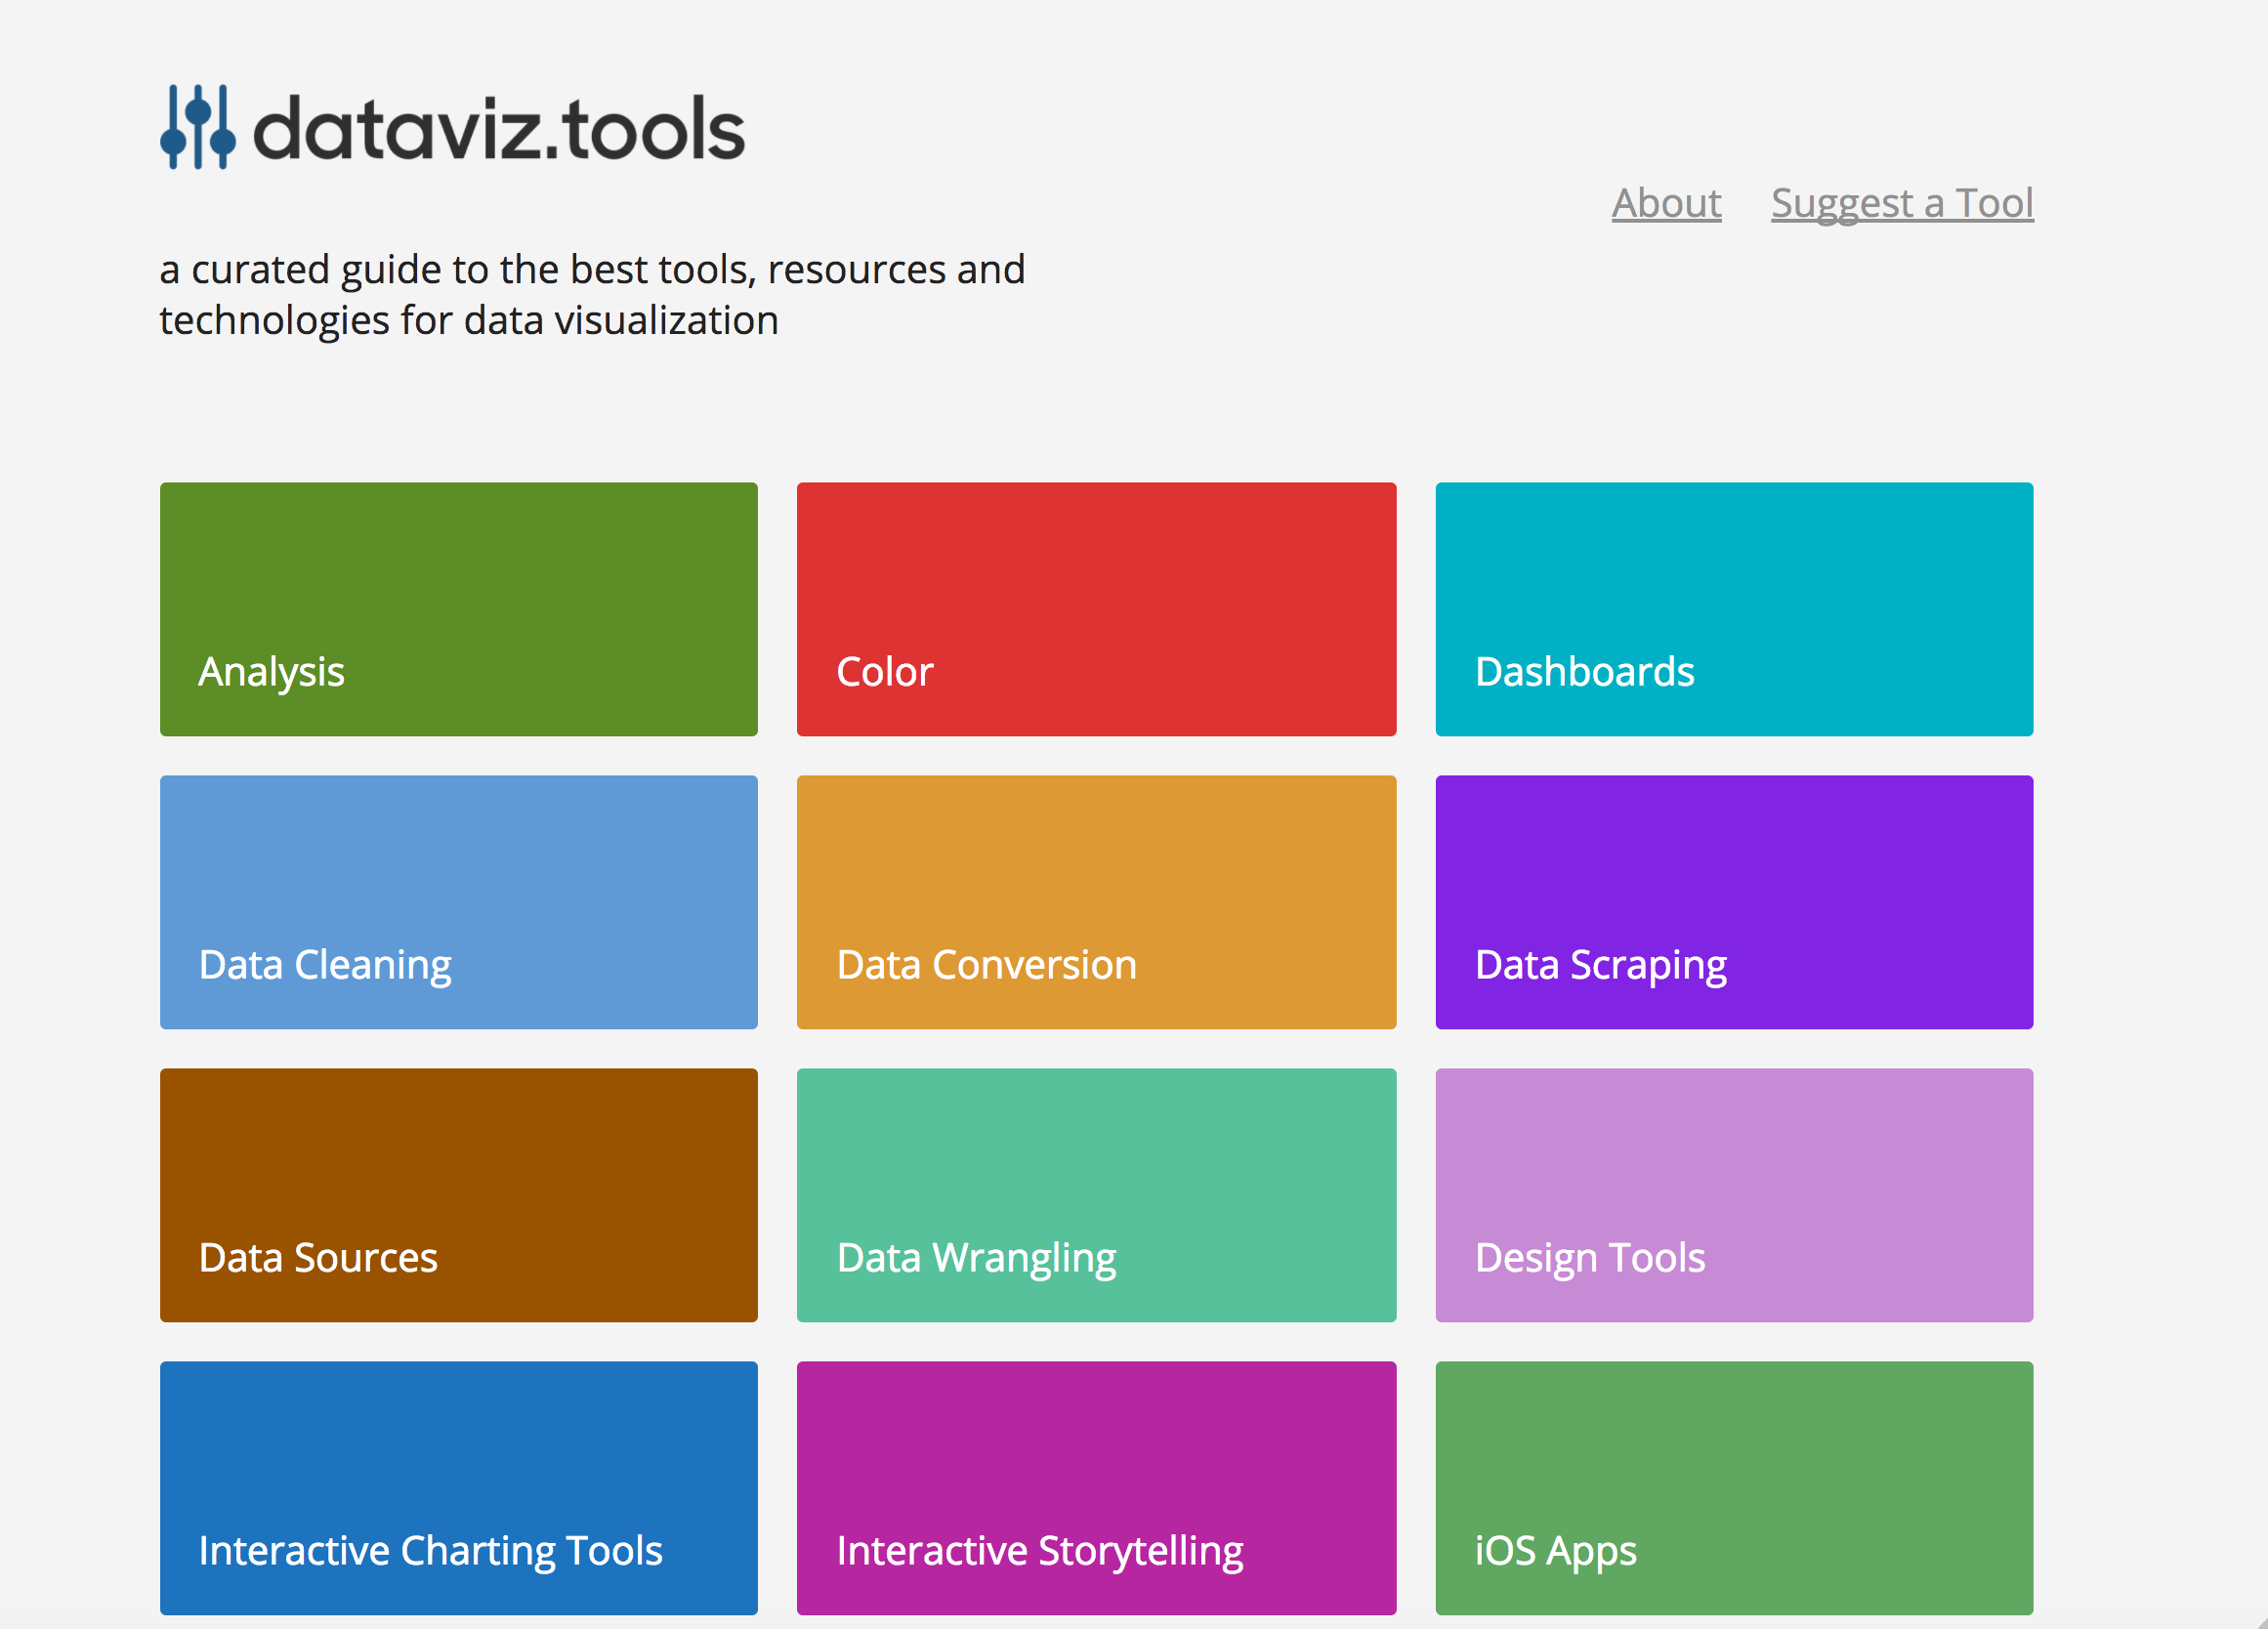 dataviz.tools▲409
Curated collection of the 400 best data visualization tools
2017 · dataviz.tools · its alternatives →
- 8

- 9

- 10
 ADS-B visualizer▲339
I've created a web app for querying and visualization of ADS-B datasets: https://adsb.exposed/ Source code: https://github.com/ClickHouse/adsb.exposed/ The results significantly exceeded my expectations because the pictures are insanely beautiful, and the data is a treasure trove. It proves many statements that were not certain: - it is feasible to generate tiles by aggregation on a pixel level (instead of hexagons or rectangular grid); - it does not require JPG/PNG tiles - we can transfer raw bitmap data with zstd compression; - it is possible to…
2024 · adsb.exposed · its alternatives →
- 11

Analytics, insights, and feature flags in one platform
2025 · databuddy.cc · its alternatives →
- 12

- 13
 Sleek Analytics▲279
Sleek Analytics is a privacy-first Google Analytics alternative for the modern web. Real-time website analytics, cookieless tracking, and fast dashboards.
Apr 2026 · getsleek.io · its alternatives →
- 14

Here's a project I've been working on for a little while now. Ripl is a JS library that provides a unified API for rendering shapes on both canvas and SVG interchangeably. Over the years I've used D3 extensively to create data visualisations so I figured I'd have a go at making my own version with a slightly more modern API and stricter TypeScript support. I am aware there are already libraries that can draw to multiple contexts interchangeably, but I've added a few little niceties to Ripl that (as far as I know) some other libraries don't have such as CSS-like query selectors, DOM-like…
2024 · github.com · its alternatives →
- 15

- 16

- 17

Hi HN, I started building Datastripes as part of my thesis, trying to answer a simple question: How can non-technical teams turn raw data into insights without relying on developers or BI tools? What began as research has now grown into a working product, built by a small team, focused on solving that exact problem. Datastripes is a no-code platform for creating dashboards and data visualizations in minutes: no SQL, no setup, no friction. What it does: Connects to CSVs, Google Sheets, or APIs Drag-and-drop dashboard builder Shareable via public links or embed Fully browser-based We’re…
Jan 2026 · datastripes.com · its alternatives →
- 18

No-code visual data transformation software tool for Windows & Mac. Download a free trial.
2019 · easydatatransform.com · its alternatives →
- 19

Create visually-equidistant palettes for data visualizations
2018 · learnui.design · its alternatives →
- 20

Intuitive analytics for open source repositories
2020 · xscode.com · its alternatives →
- 21RI
2011 · repoplay.com · its alternatives →
- 22

The federated data analytics platform, loved by Pandas
2021 · its alternatives →
- 23

Turn codebases into interactive maps, graphs, and governance
Jul 2026 · dev-swat.com · its alternatives →
- 24

Create stunning README.md's for your projects with repobeats
2021 · repobeats.axiom.co · its alternatives →
Also compare
Ranked by how close each launch is in meaning, then by votes. Prices were read from each product’s own site when checked and can change. Refine with your own description →