Growth · alternatives · 2026

24 alternatives to Semspect
Visual Analytics tool for Graph databases
Below are 24 products that do a similar job, ranked by how close each is in meaning and then by launch-day votes. Semspect launched in 2019; newer entries below may have overtaken it.
- 1

Create pro-level graphs that drive actions
2024 · graphy.app · its alternatives →
- 2
 Glazed▲867
Turn Figma files into production-ready tracking in minutes
2024 · glazedanalytics.com · its alternatives →
- 3

- 4

Content ideas that resonate with your audience
2018 · semrush.com · its alternatives →
- 5

Competitive intelligence for entering new markets and niches
2019 · semrush.com · its alternatives →
- 6

- 7

Visualize boring data into beautiful charts & graphs.
2017 · visme.co · its alternatives →
- 8LT
2015 · linkurio.us · its alternatives →
- 9
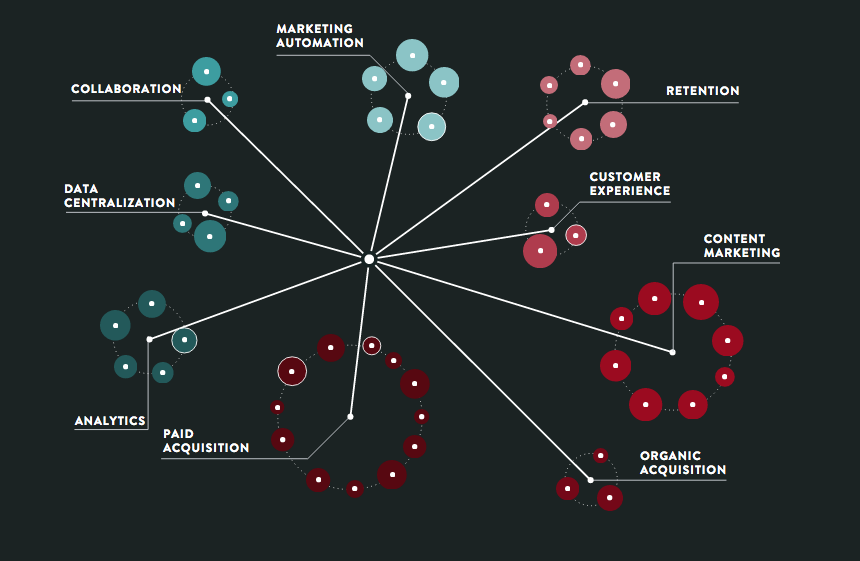 Growthverse▲233
An interactive visualization of marketing tech tools
2015 · growthverse.com · its alternatives →
- 10KG
Hi HN! My latest side project is knowledge graph that maps the French culinary network using data extracted from restaurant reviews from LeFooding.com. The project uses LLMs to extract structured information from unstructured text. Some technical aspects you may be interested in: - Used structured generation to reliably parse unstructured text into a consistent schema - Tested multiple models (Mistral-7B-v0.3, Llama3.2-3B, gpt4o-mini) for information extraction - Created an interactive visualization using gephi-lite and Retina (WebGL) - Built (with Claude) a simple Flask web app to clean and…
2025 · theophilecantelob.re · its alternatives →
- 11

- 12

Real-time analytics for APIs and microservices
2015 · konghq.com · its alternatives →
- 13

Data analysis that works for engineers. World-leading time series data analysis platform for engineering teams.
2020 · getmarple.io · its alternatives →
- 14

Hey HN! We are Jonathan & Guy, and we are happy to share a project we’ve been working on. ChartDB is a tool to help developers and data analysts quickly visualize database schemas by generating ER diagrams with just one query. A unique feature of our product is AI-Powered export for easy migration. You can give it a try at https://chartdb.io and find the source code on GitHub. Next steps ---> More AI. We’d love feedback :)
2024 · github.com · its alternatives →
- 15
 Mode Analytics▲105
Tools to connect data and the people who analyze it.
2014 · app.mode.com · its alternatives →
- 16

- 17
 Embedful ▲150
Easy data visualizations. Embed and share anywhere.
Mar 2026 · embedful.io · its alternatives →
- 18
 Semaphor▲90
Embed fully-customizable interactive dashboards in your apps
2024 · semaphor.cloud · its alternatives →
- 19

- 20

Inspectus allows you to create interactive visualizations of attention matrices with just a few lines of Python code. It’s designed to run smoothly in Jupyter notebooks through an easy-to-use Python API. Inspectus provides multiple views to help you understand language model behaviors. If you have any questions, feel free to ask!
2024 · github.com · its alternatives →
- 21

- 22
 Embedding Atlas▲150
Hey HN, we're happy to release Mycelium, a JavaScript library for creating graph visualizations of machine learning models or any other directed acyclic graphs. Mycelium powers the graph viewer of the Talaria [0] a research model visualization and optimization system, which was used to optimize the efficiency of Apple Foundation Models [1]. Everything works entirely on the client-side in the browser — we provide a rudimentary ONNX loader out of the box, which you can try by dragging model files into our website. It is also simple to define loaders for your own model formats. The library was…
2025 · apple.github.io · its alternatives →
- 23
 QueryTree▲78
Straightforward data reporting and visualization
2017 · querytreeapp.com · its alternatives →
- 24

Also compare
Ranked by how close each launch is in meaning, then by votes. Prices were read from each product’s own site when checked and can change. Refine with your own description →