Life & fun · alternatives · 2026
24 alternatives to Smogmap
Real-time pollution information map in daily cigarettes
Below are 24 products that do a similar job, ranked by how close each is in meaning and then by launch-day votes. Smogmap launched in 2020; newer entries below may have overtaken it.
- 1
 ShowMeAQI▲12
See What air pollution actually looks like outside
Jan 2026 · showmeaqi.com · its alternatives →
- 2

The smart air quality tracker to help you find clean air
2017 · plumelabs.com · its alternatives →
- 3

- 4

- 5

2021 · weatherspark.com · its alternatives →
- 6
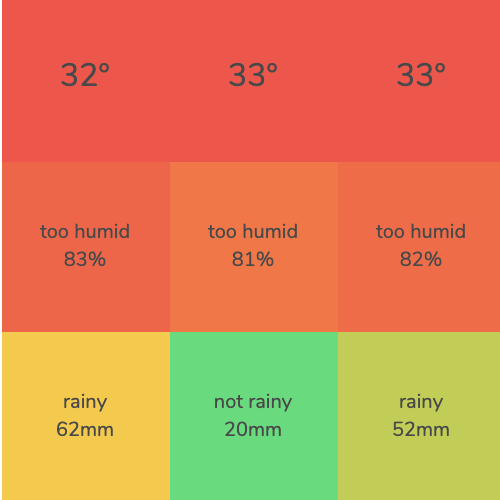 Climate Finder▲438
Pick temperature and air quality and find places that match
2020 · its alternatives →
- 7

The world's smallest particulate pollution monitor
2018 · breathe-tech.com · its alternatives →
- 8

Monitor your world with Enviro and Enviro + Air Quality for Raspberry Pi!
2019 · shop.pimoroni.com · its alternatives →
- 9
 Haze▲60
Live air quality and weather in a simple and clear design.
2021 · apps.apple.com · its alternatives →
- 10

- 11My!hū▲81
See global environmental data in one real-time platform.
Apr 2026 · app.myhu.world · its alternatives →
- 12
 Sh**t! I Smoke▲111
See your city's air pollution measured in daily cigarettes.
2018 · shootismoke.app · its alternatives →
- 13

- 14

Visualizing the air quality on your street in real time
2017 · airview.blueair.com · its alternatives →
- 15

- 16

GB Renewables Map an energy experiment created entirely in my free time (day job is visualisation at Octopus Energy). It's an interactive map showing live generation for major wind farms in Great Britain, showing what each wind farm is generating both now and in the past, and where that generation is physically located. Animated weather data is from WeatherLayers and shows current and historic wind conditions on the map, providing context to wind generation around the country. History mode allows you to go back in time and see wind generation and weather conditions for a particular date and…
2023 · renewables-map.robinhawkes.com · its alternatives →
- 17

Using smart thermometers to detect surges in COVID-19 cases
2020 · extensive.io · its alternatives →
- 18RT
2017 · map.keymetrics.io · its alternatives →
- 19

- 20
Air quality info for many countries all over the world
2023 · play.google.com · its alternatives →
- 21
 AirCare 2.0▲71
App to track air quality, pollen, UV and fires
2022 · getaircare.com · its alternatives →
- 22
 Electricity Map▲100
Live CO2 emissions of electricity consumption
2017 · electricitymaps.com · its alternatives →
- 23
 Ouranos▲8
Weather Forecast & Light Pollution Maps for Astronomers
2024 · ouranos-app.com · its alternatives →
- 24
 Smokr▲4
A visual smoking tracker that shows real impact
Feb 2026 · play.google.com · its alternatives →

Also compare
Ranked by how close each launch is in meaning, then by votes. Prices were read from each product’s own site when checked and can change. Refine with your own description →