Dev tools · alternatives · 2026

24 alternatives to Surrealist
Build smarter knowledge graphs for data-rich applications
Surrealist is a visualization tool for SurrealDB that displays database queries as interactive knowledge graphs. It helps developers explore data relationships and patterns in real time by combining graph, vector, and… Below are 24 products that do a similar job, ranked by how close each is in meaning and then by launch-day votes.
- 1

I went down the rabbit hole on a side project and ended up building this: Strange Attractors(https://blog.shashanktomar.com/posts/strange-attractors). It’s built with three.js. Working on it reminded me of the little "maths for fun" exercises I used to do while learning programming in early days. Just trying things out, getting fascinated and geeky, and being surprised by the results. I spent way too much time on this, but it was extreme fun. My favorite part: someone pointed me to the Simone Attractor on Threads. It is a 2D attractor and I asked GPT to extrapolate it to…
Oct 2025 · blog.shashanktomar.com · its alternatives →
- 2

Create pro-level graphs that drive actions
2024 · graphy.app · its alternatives →
- 3

- 4
 Eureka▲291
Turn any knowledge into an explorable visual map, AI-powered
Dec 2025 · eurekaweb.app · its alternatives →
- 5

- 6

Hi HN! I’m Alex from Parabola (https://parabola.io). Parabola is a visual programming tool for creating functional data flows that everyone can use. It’s entirely drag-and-drop, handles data sizes much larger than a traditional spreadsheet, calculates everything live, and can run your flows on a schedule of your choosing. I used to work in strategy consulting, doing data analytics for SMBs and Fortune 500 companies. The amount of time wasted on menial tasks was astounding. Things like cleaning data, generating custom reports, creating human workflows to solve shortcomings in third…
2018 · parabola.io · its alternatives →
- 7KA
2015 · williamngan.github.io · its alternatives →
- 8LA
2020 · symbolflux.com · its alternatives →
- 9

AI rendering tool to create realistic visualizations
2024 · visualizee.ai · its alternatives →
- 10
 Graphiti▲307
Build personalized AI agents that learn from dynamic data
2025 · github.com · its alternatives →
- 11
- 12

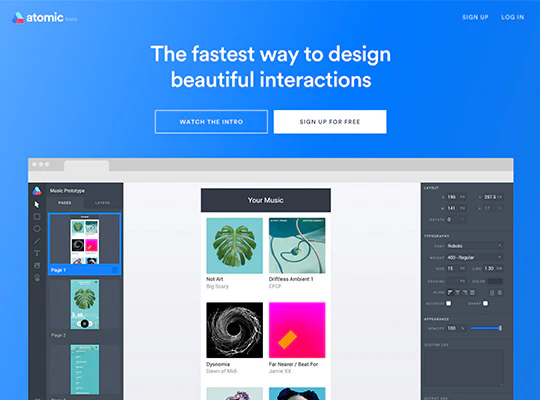
One year ago I open-sourced my very first 'real' project and shared it here. I was a college student in my senior year and desperately looking for a job. At the time of sharing it i couldn't even afford a domain and naively let someone buy the one i had my eyes on lol. It's been a hell of a year with this blowing up, me moving to another country, and switching 2 jobs. In a year we somehow managed to hit 26k stars, grow a 1000+ person discord community, and support 37 languages. I couldn't be more grateful for the community that helped this grow, but now i don't know what direction to take…
2025 · drawdb.app · its alternatives →
- 13

Turn a Reddit complaint into your next company
Jul 2026 · theeurekadatabase.com · its alternatives →
- 14

Data visualizations are the bridge between user and data. But building AI agents that can generate visualizations reliably can be very tricky: - simple chart specs can be reliable, but generated charts are often of low quality due to reliance on system defaults; - complex chart specs with explicit details can produce good-looking charts, but they are verbose and agents can struggle with reliability We figured out it is a limitation on the language issue (not just AI capability thing) -- current visualization languages are a bit too low-level for AI agents, requiring them to explicitly make…
Jul 2026 · microsoft.github.io · its alternatives →
- 15

- 16

- 17

Creating high-quality scientific figures can be time-consuming and challenging, even though sketching ideas on paper is relatively easy. Furthermore, recreating existing figures that are not stored in formats preserving semantic information is equally complex. To tackle this problem, we introduce DeTikZify, a novel multimodal language model that automatically synthesizes scientific figures as semantics-preserving TikZ graphics programs based on sketches and existing figures. We also introduce a Monte Carlo Tree Search-based inference algorithm that enables DeTikZify to iteratively refine its…
2024 · github.com · its alternatives →
- 18
 Creately 3.0▲365
The simplest way to visualize ideas, plans & processes
2020 · creately.com · its alternatives →
- 19TL
2018 · charts.com · its alternatives →
- 20VG
2020 · treksit.netlify.app · its alternatives →
- 21

- 22
 CalcGen AI▲123
Beautifully interactive data visualizations. One prompt.
2024 · welcome.calcgen.ai · its alternatives →
- 23
 Dreambase.ai▲264
Fully integrated analytics from Supabase. Free to use.
2025 · dreambase.com · its alternatives →
- 24

Hey all! I released drawDB about a month ago and now it's open source. I hope you find it useful. If you want to check out the app you can go to https://drawdb.vercel.app/ . Thank you:)
2024 · github.com · its alternatives →
Also compare
Ranked by how close each launch is in meaning, then by votes. Prices were read from each product’s own site when checked and can change. Refine with your own description →