Life & fun · alternatives · 2026

24 alternatives to TauCharts
Flexible javascript charting library for data exploration
Below are 24 products that do a similar job, ranked by how close each is in meaning and then by launch-day votes. TauCharts launched in 2015; newer entries below may have overtaken it.
- 1
 Chart.js▲263
Simple, clean & engaging charts for designers and developers
2014 · chartjs.org · its alternatives →
- 2
 Recharts▲155
A composable charting library built on React components
2016 · recharts.org · its alternatives →
- 3

Open source D3.js-based charting and visualization library for data exploration and data analysis
2015 · taucharts.com · its alternatives →
- 4
 Chart.js 2.0▲440
Simple, clean & engaging charts for designers & developers.
2016 · chartjs.org · its alternatives →
- 5
 Chart.js 4.0▲111
Open source JavaScript charting library for the modern web
2022 · github.com · its alternatives →
- 6

- 7

- 8
 AnyChart▲136
Interactive JavaScript HTML5 based charting solution
2015 · anychart.com · its alternatives →
- 9

- 10TL
2018 · charts.com · its alternatives →
- 11
 Plottable.js▲132
Flexible, interactive charts for the web.
2016 · plottablejs.org · its alternatives →
- 12

- 13
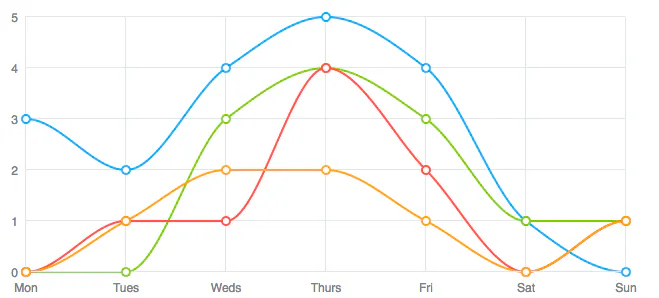 ZingChart▲92
JS Charting library that renders in HTML5, Canvas & Flash
2014 · zingchart.com · its alternatives →
- 14

- 15

Responsive HTML5 charts with 10x performance
2017 · canvasjs.com · its alternatives →
- 16

Data presentation and collaboration
2015 · apps.apple.com · its alternatives →
- 17
 Growthverse▲233
An interactive visualization of marketing tech tools
2015 · growthverse.com · its alternatives →
- 18
 Epoch▲95
A general purpose library for building real-time charts.
2014 · fastly.github.io · its alternatives →
- 19US
2015 · imaginea.github.io · its alternatives →
- 20

📈 A small, fast chart for time series, lines, areas, ohlc & bars - leeoniya/uPlot
2019 · github.com · its alternatives →
- 21
- 22
 Variance▲91
Build powerful data visualizations for the web.
2014 · variancecharts.com · its alternatives →
- 23
 Data Wrapper▲75
Open source simple, correct, embeddable charts in minutes
2014 · datawrapper.de · its alternatives →
- 24

API for beautiful interactive graphics from time-series data
2014 · metricsgraphicsjs.org · its alternatives →
Also compare
Ranked by how close each launch is in meaning, then by votes. Prices were read from each product’s own site when checked and can change. Refine with your own description →