Dev tools · alternatives · 2026

24 alternatives to US Salary Dataset 113 Roles × 30 Cities
3,360 US salary data points · 113 roles · 30 cities · CSV
Below are 24 products that do a similar job, ranked by how close each is in meaning and then by launch-day votes.
- 1

Since 2012 the US tech industry has sponsored 176,075 H1B work visas. With an average individual salary up to $39,465 above median household income.
2015 · swizec.github.io · its alternatives →
- 2

Two roles. Who earns more? Real US salary data.
May 2026 · salaryduel.com · its alternatives →
- 3
 Comprehensive.io▲107
Tracking the salary ranges of 1,000+ tech companies
2023 · comprehensive.io · its alternatives →
- 4
 Comp.fyi▲81
Open engineering compensation data by company, level & skill
2018 · levels.fyi · its alternatives →
- 5

2023 · germantechjobs.de · its alternatives →
- 6

How much U.S. households have left after essentials, by income group, from BLS Consumer Expenditure Survey data 2000–2024 (projected to 2026), and what investing it would grow to.
Sep 2026 · whats-left-over.pages.dev · its alternatives →
- 7

See where your salary ranks using official BLS data
May 2026 · rankmysalary.com · its alternatives →
- 8H1
Excited to share my New Year’s project. For a long time, I’ve wanted to build H-1B data directly into Levels.fyi. Every time I went looking for this data elsewhere, it was a frustrating experience to use. Most H-1B sites felt antiquated, unintuitive, cluttered with ads, or just overwhelming to use. The data was there, but it wasn’t usable, and definitely not pleasant to explore. So out of that frustration, I decided to build the H-1B data experience I personally wanted to use. Right into Levels.fyi. https://levels.fyi/h1b/ Some other pages I'm excited about: Wage Heatmap:…
Jan 2026 · its alternatives →
- 9
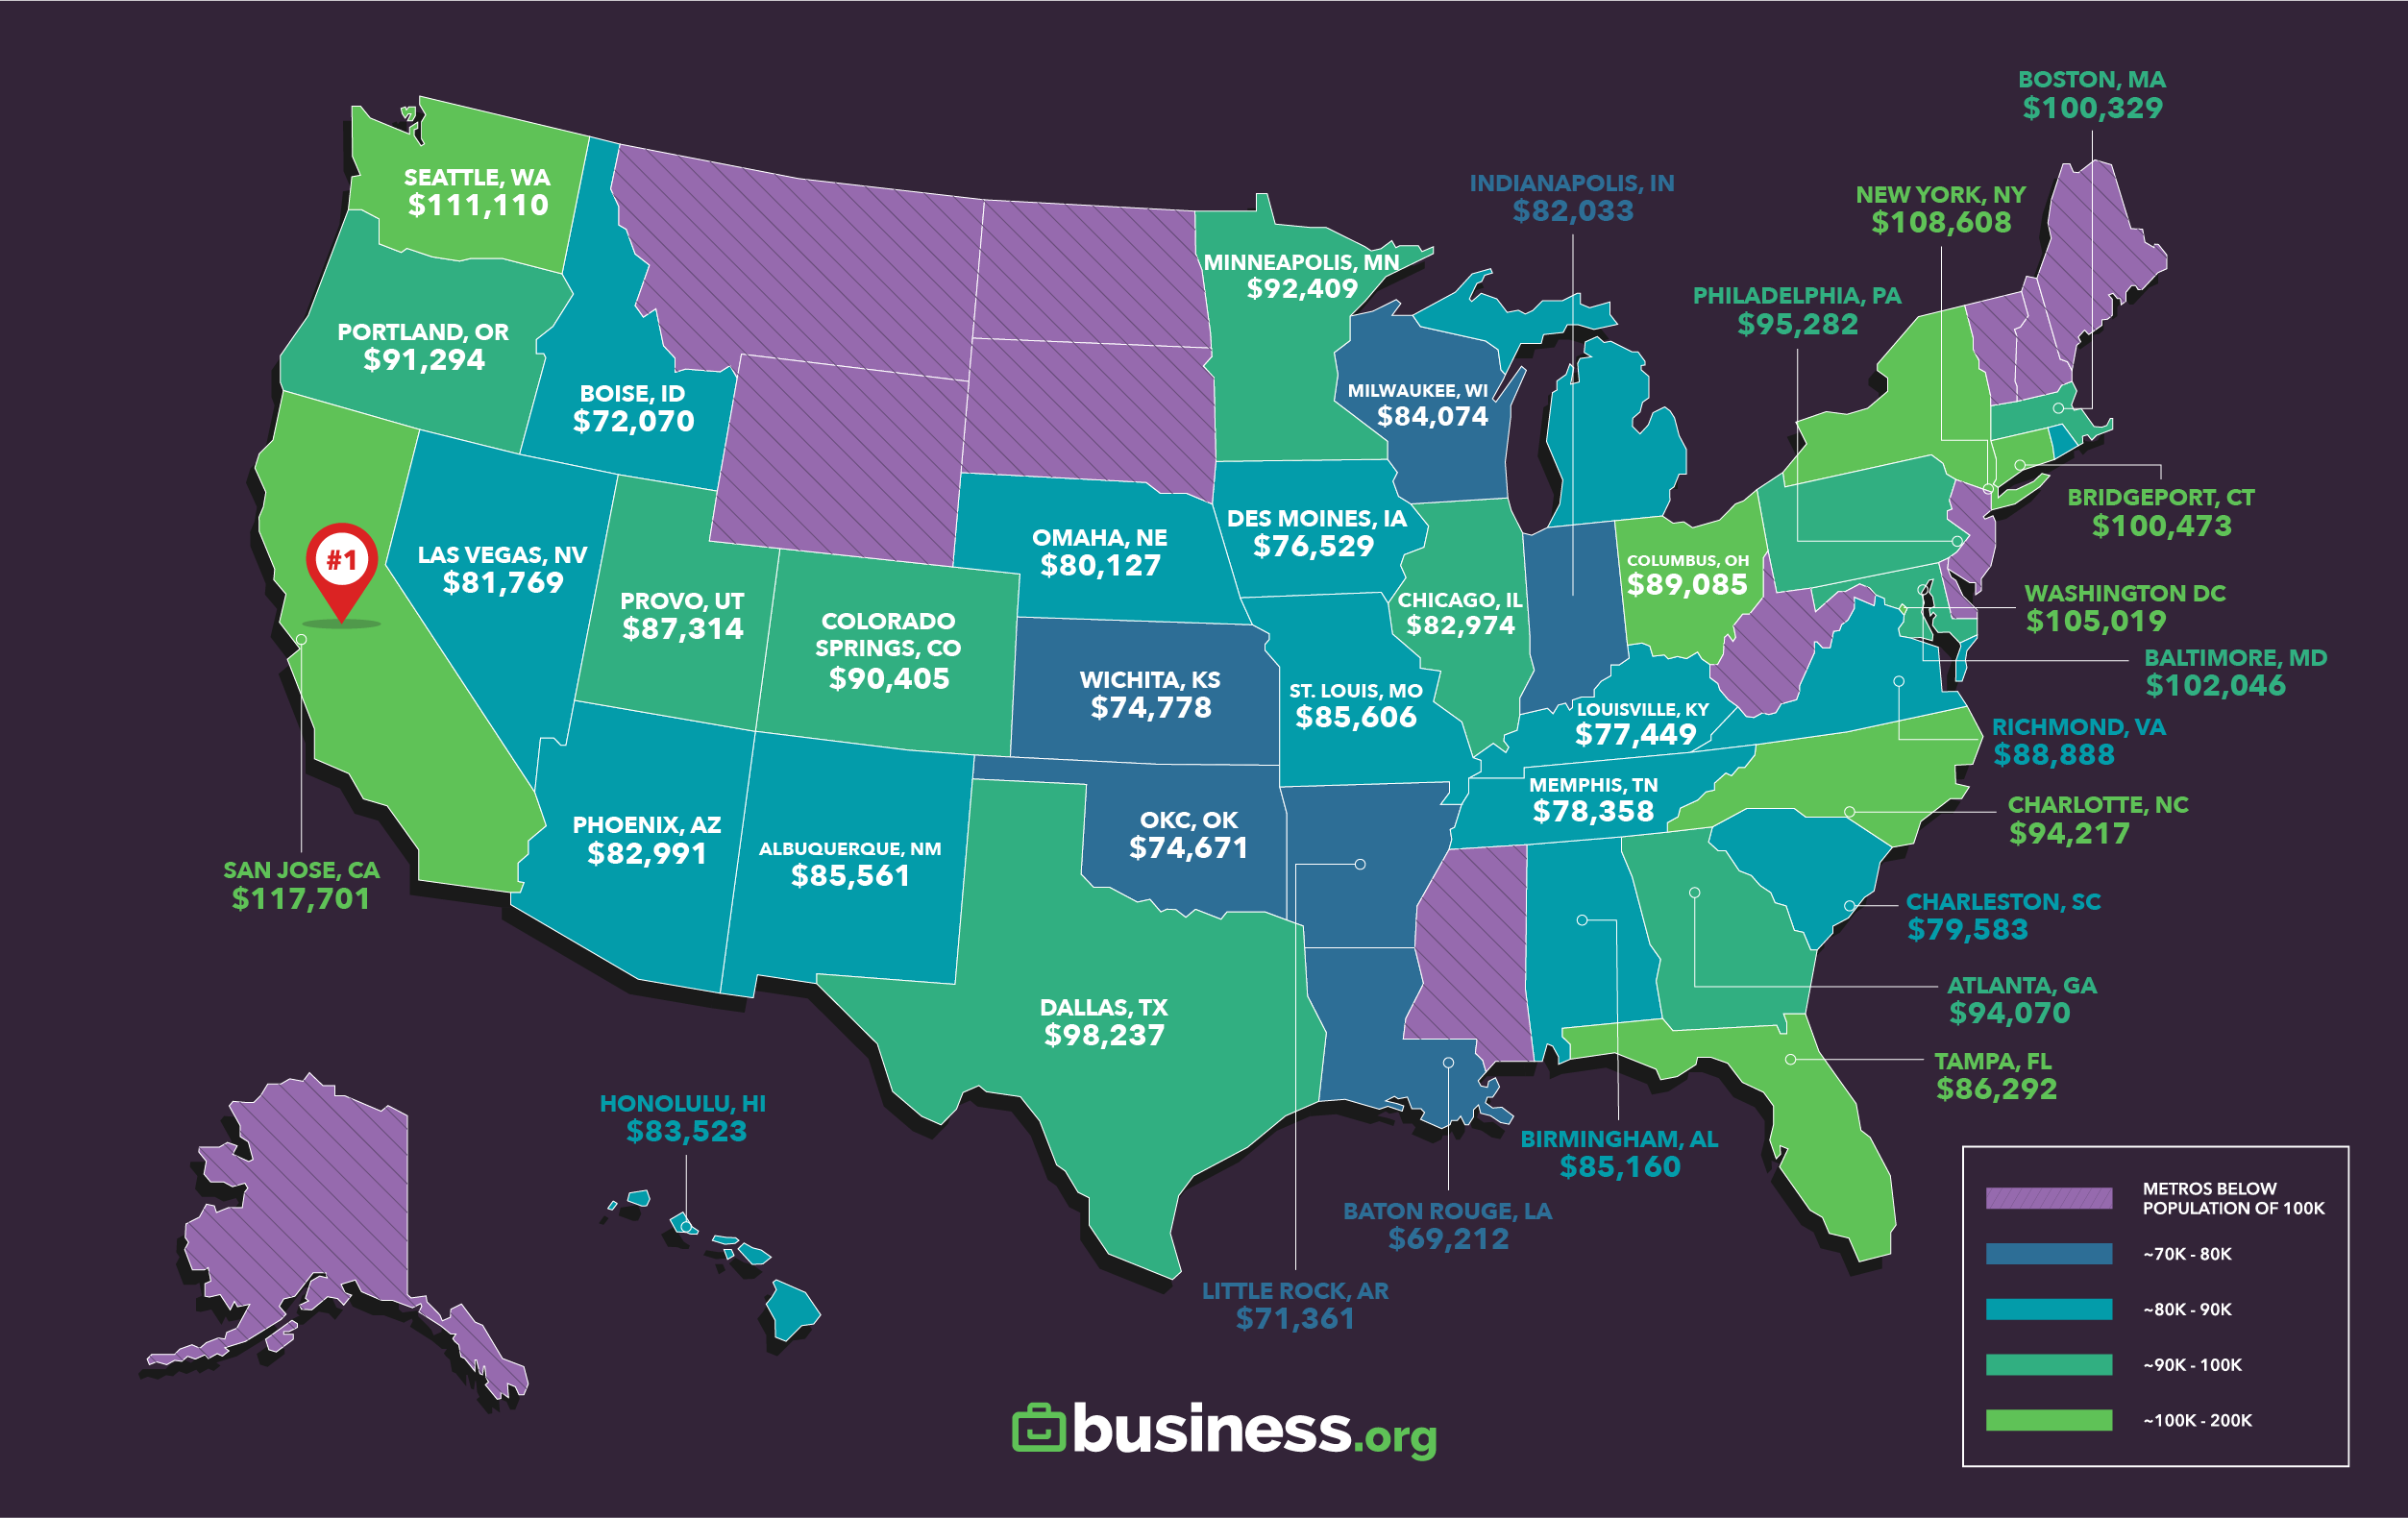
A visualization of a Salary Survey taken by the IT community
2024 · itsalarymap.com · its alternatives →
- 10

Some time ago, I tried to scrape every Bay Area profile off LinkedIn until the site blocked my entire office network (Lesson learned: Use a proxy). This was Bad because we were (and still are!) hir…
2016 · elaineou.com · its alternatives →
- 11HH
Hi HN! A few days ago I saw a graph[0] that showed the # of job postings on HN was declining. I started wondering what other trends I could glean from the data, so I created this! You can filter through the top level comments by keyword; for example you can filter by "remote" to see the massive spike around March 2020. Another interesting thing I found is that I can compare hiring across cities. I hope you enjoy! I made it so that the links to your search are sharable so if you have some interesting data you should be able to just link the page you're on! [0]…
2023 · hnhiringtrends.com · its alternatives →
- 12
- 13

Find the salary rates based on jobs and locations
Apr 2026 · salarylookup.org · its alternatives →
- 14

- 15

- 16WP
2025 · thepricer.org · its alternatives →
- 17SC
2016 · teleport.org · its alternatives →
- 18

Find the right city for your next remote office.
2019 · beyondhq.co · its alternatives →
- 19
- 20

Using statistics provided by the Bureau of Labor Statistics
2016 · play.google.com · its alternatives →
- 21
 PayScope▲63
Resume-based salary estimate from real-time market data
2025 · payscope.ai · its alternatives →
- 22IH
2022 · echojobs.io · its alternatives →
- 23

2023 · swissdevjobs.ch · its alternatives →
- 24

Show HN: I built a tool to calculate real tech salaries across cities (after tax & COL) As a software engineer obsessed with data-driven decisions, I wanted to quantify how much better/worse other cities would be compared to my current home in Berlin. While sites like Glassdoor and levels.fyi tell you how much you can earn, they don't show what you actually keep after taxes and living costs. So I built Tech City Index - a tool that compares cities based on actual purchasing power for software engineers, combining: * Real-time salary data from levels.fyi * Cost of living data from Numbeo…
2025 · techcities.app · its alternatives →

Also compare
- A histogram of salaries given to H1B workers in the software industry alternatives
- SalaryDuel · Game alternatives
- Comprehensive.io alternatives
- Comp.fyi alternatives
- Software Developer salaries in Germany by technology and city alternatives
- The bottom 50% of U.S. households are short after essentials (BLS data) alternatives
Ranked by how close each launch is in meaning, then by votes. Prices were read from each product’s own site when checked and can change. Refine with your own description →