Growth · alternatives · 2026

24 alternatives to VisTools
Data visualization tools
Below are 24 products that do a similar job, ranked by how close each is in meaning and then by launch-day votes. VisTools launched in 2017; newer entries below may have overtaken it.
- 1

- 2

- 3

Visualize boring data into beautiful charts & graphs.
2017 · visme.co · its alternatives →
- 4

- 5
 Growthverse▲233
An interactive visualization of marketing tech tools
2015 · growthverse.com · its alternatives →
- 6

The future of online data visualization tools
2016 · policyviz.com · its alternatives →
- 7

- 8

- 9

- 10

- 11

- 12
- 13

- 14
 Variance▲91
Build powerful data visualizations for the web.
2014 · variancecharts.com · its alternatives →
- 15

- 16ND
2014 · blog.spritesapp.com · its alternatives →
- 17

- 18
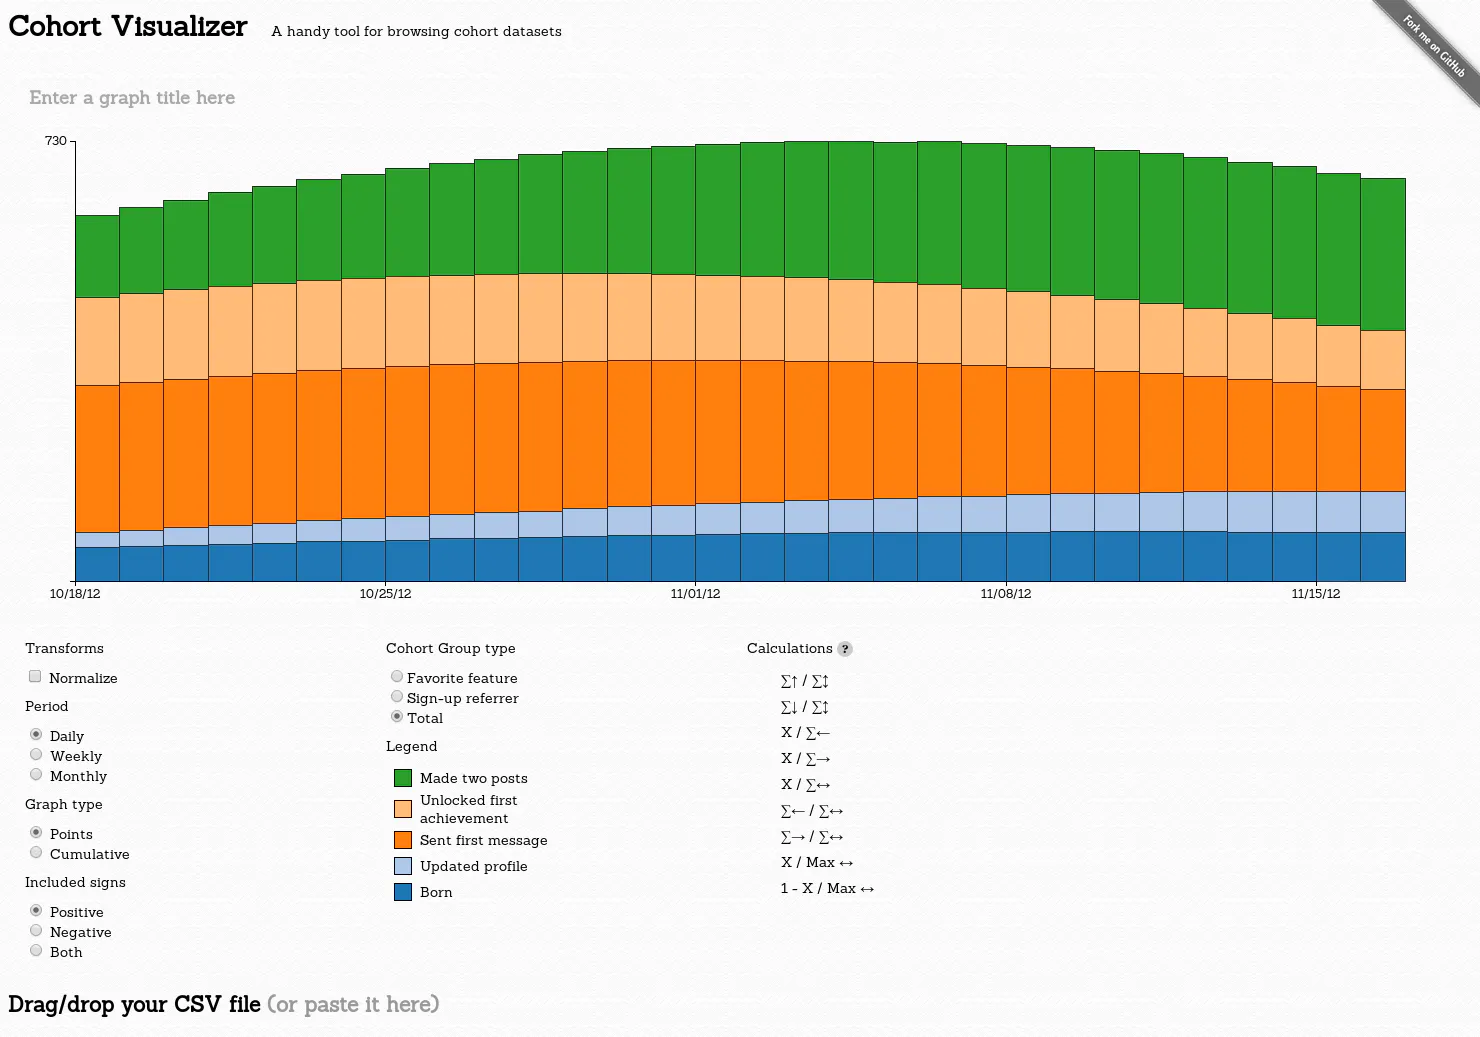
A handy tool for browsing cohort datasets
2014 · bslatkin.github.io · its alternatives →
- 19
- 20

- 21VO
Hello HN. I've always found writing data visualisation scripts boring and repetitive in data science workflows earlier in my career, so I built this tool to automate it. The available methods are based on my experience in econometrics where histograms and scatterplots were the starting points to check data distributions. The link is to the documentation and the app is freely available at https://visprex.com, and if you're curious about the implementation it's open source at https://github.com/visprex/visprex. I'd appreciate any comments and feedback!
2024 · docs.visprex.com · its alternatives →
- 22

- 23

- 24

Also compare
Ranked by how close each launch is in meaning, then by votes. Prices were read from each product’s own site when checked and can change. Refine with your own description →