Life & fun · alternatives · 2026
24 alternatives to Visually Create
Dynamic Data-Driven Infographics
Below are 24 products that do a similar job, ranked by how close each is in meaning and then by launch-day votes. Visually Create launched in 2015; newer entries below may have overtaken it.
- 1
- 2

- 3

Taking infographics & data-visualisation next level (book)
2014 · amazon.com · its alternatives →
- 4

- 5
 Visual.ly▲118
Marketplace for Infographics and Other Visual Content
2014 · visual.ly · its alternatives →
- 6

- 7
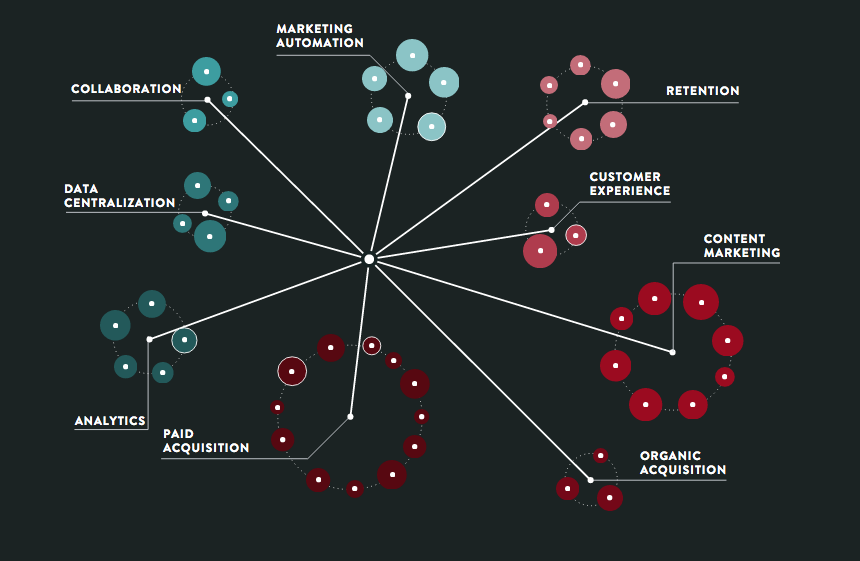 Growthverse▲233
An interactive visualization of marketing tech tools
2015 · growthverse.com · its alternatives →
- 8

Ideas, issues, knowledge, data — visualized!
2015 · informationisbeautiful.net · its alternatives →
- 9Variance▲91
Build powerful data visualizations for the web.
2014 · variancecharts.com · its alternatives →
- 10

- 11

- 12
- 13
- 14

- 15

- 16

- 17
- 18
 Tabletop Whale▲140
Gorgeous science infographics you can learn from
2017 · tabletopwhale.com · its alternatives →
- 19
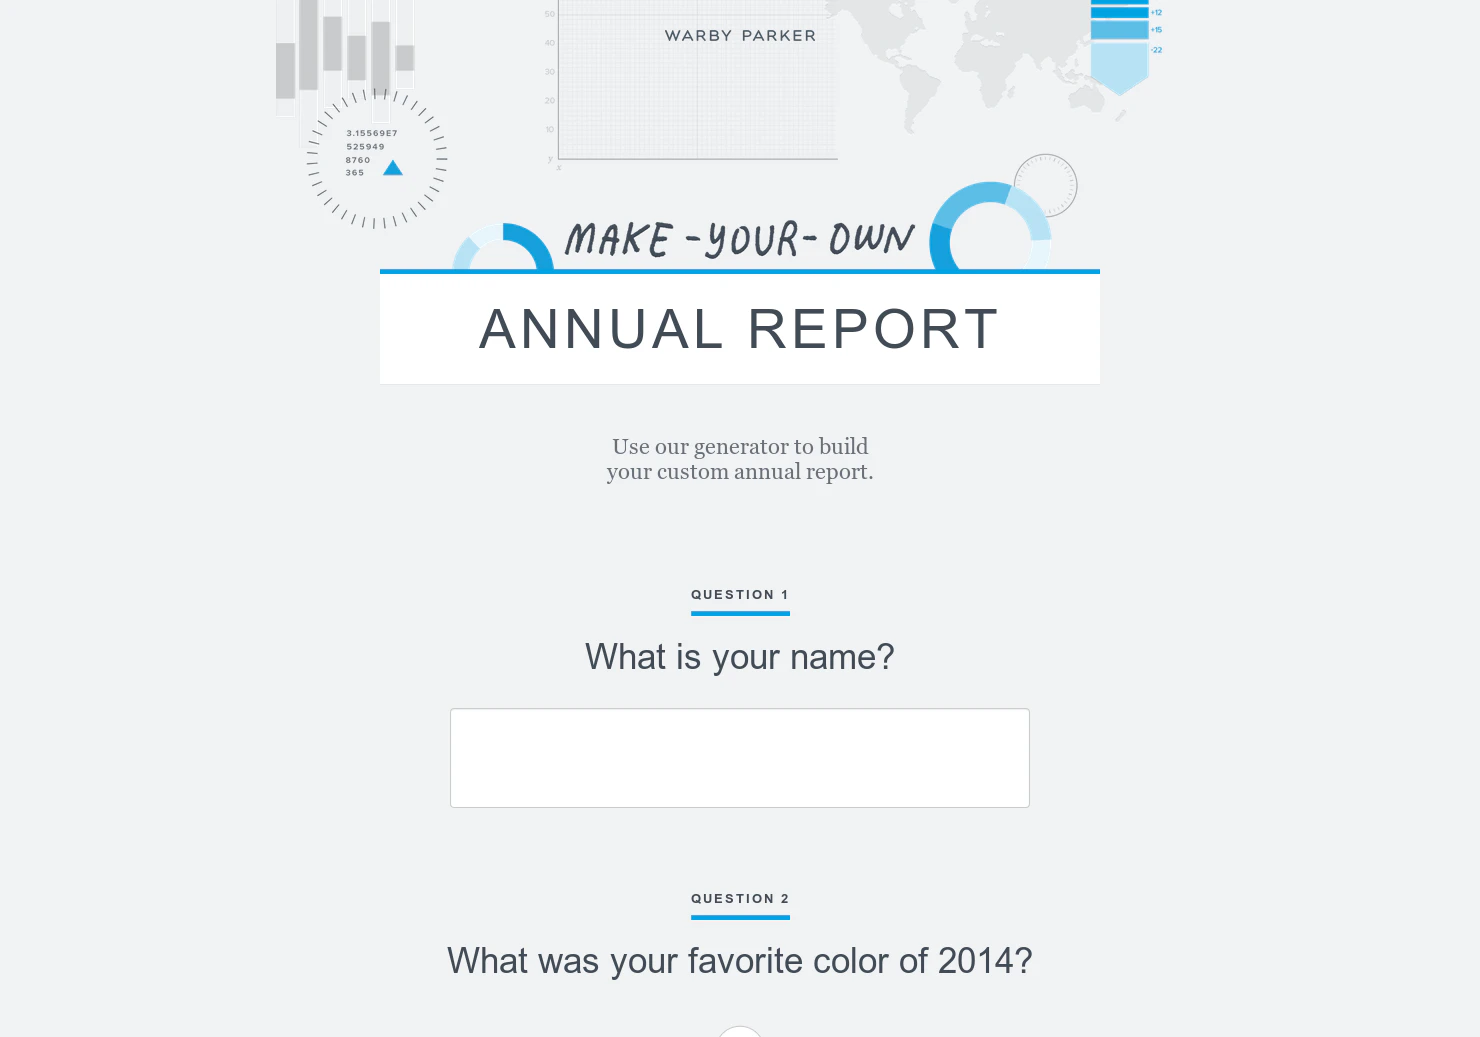
Your very own annual report infographic
2015 · warbyparker.com · its alternatives →
- 20

Shared visualizations of content, ideas, and decisions
2015 · 10000ft.com · its alternatives →
- 21

- 22

- 23
- 24
Also compare
Ranked by how close each launch is in meaning, then by votes. Prices were read from each product’s own site when checked and can change. Refine with your own description →