
AddCharts – Add Analytics Charts to Intercom.io
AddCharts – Add Analytics Charts to Intercom.io launched on July 1, 2015 with 13 votes, #1,649 of 4,208 launches that month and more than 75% of that year's launches. The site was still online in September 2026, 11 years on.
In plain words
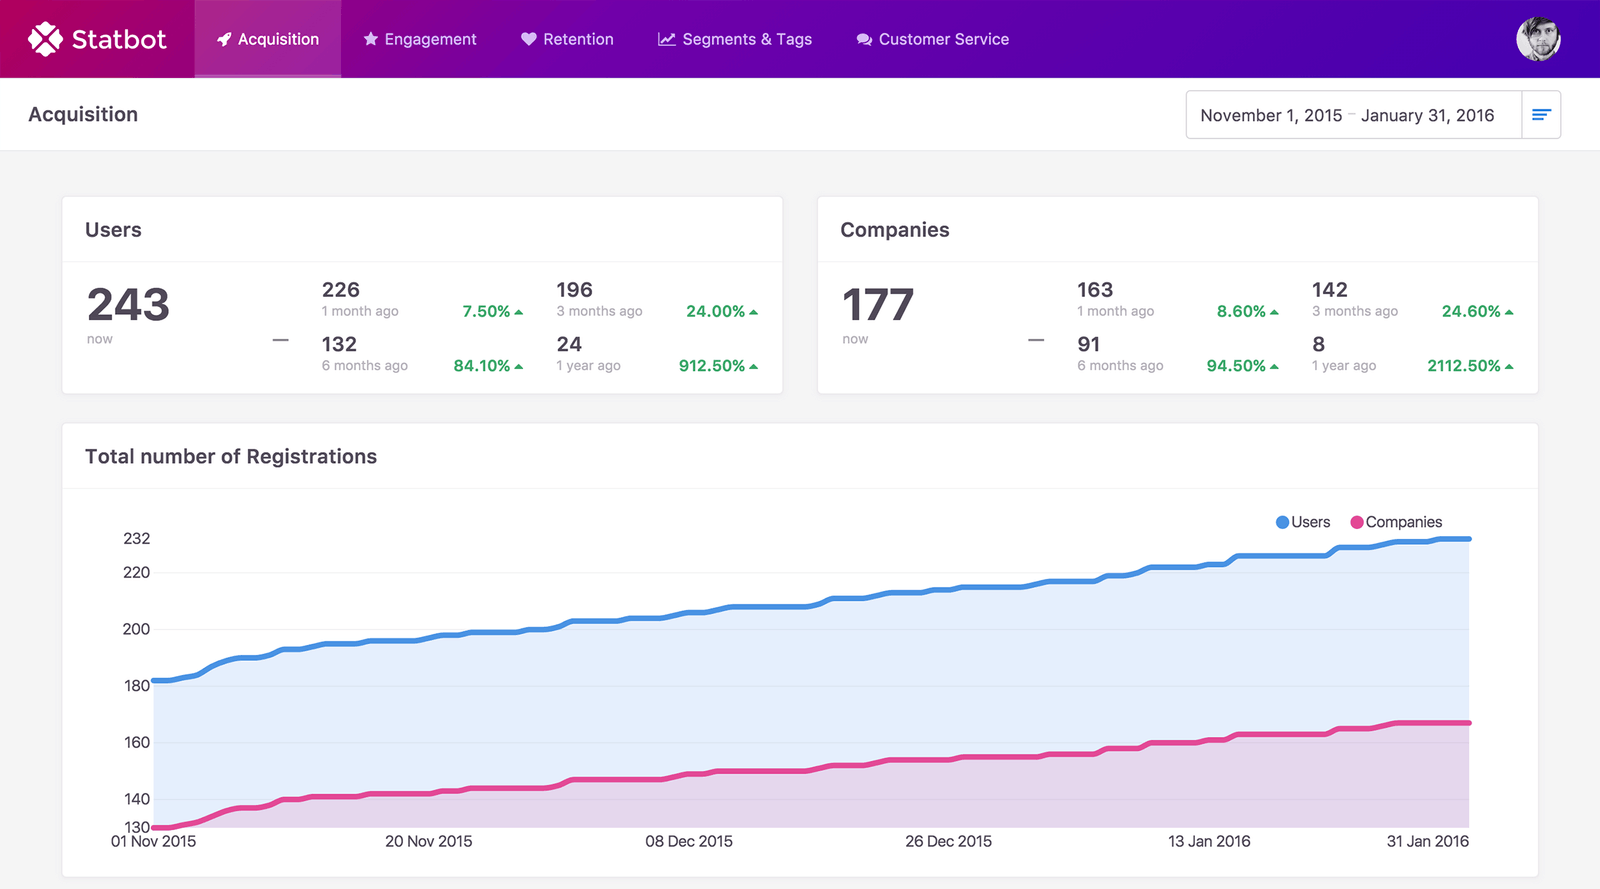
AddCharts integrates analytics dashboards directly into Intercom.io, allowing users to visualize and interact with their Intercom data. The tool lets users preview metrics, add or remove charts, compare tags and segments, and sync their account with a single click. Currently in beta and free to use, AddCharts is designed for Intercom users who want better visibility into their customer communication analytics without leaving the platform.
written from the facts on this page · September 2026
From the sources
Preview and interact with our live demo get the real feel of the dashboard in action. No catch! AddCharts is currently in the beta stage, that's why it's 100% free . All you need to do is click the connect with intercom button and right away your AddCharts dashboard will be synced with your Intercom account. You can view all your Intercom data, add and remove graphs & metrics, compare tags and segments and muchfrom addcharts.com
Does a similar job
all alternatives →


 An all-new Intercom2018 · intercom.com · ▲410
A bold aesthetic. Simplified navigation. Faster workflows.

More life & fun this month
the category →
A free city-building game in your browser. You are the mayor. You know what the city needs. Now get it past the zoning board, the neighbors, the appeals court and the next election.
Life & fun · 2d ago · permit.petercai.com
- IV
Life & fun · 14d ago · tanzaniaeducationproject.org

Turn a phone, tablet or TV into a sign. Type a message and it fills the screen: welcome signs, timers, Wi-Fi passwords and more. No app, no account, free.
Life & fun · 15d ago · bigwords.page

Play a free virtual guitar online with your keyboard or by touch. Slow songs down and see every chord, string and strum. Acoustic, classic, electric and bass.
Life & fun · 9d ago · guitoro.com

Carrier settings from iPhone, Pixel and Galaxy firmware, decoded and compared: APNs, VoLTE, 5G and Wi-Fi Calling per carrier, and what each build changed.
Life & fun · 13d ago · carrierexplode.com

Life & fun · 23d ago · space.bl2.net
Source: Show HN post ↗
Launched alongside, July 2015
the whole month → Hotjar▲1,312
See how visitors are using your site and get visual feedback
Growth · 2015 · contentsquare.com
 Spot the Drowning Child▲1,215
Can you spot the drowning child in this crowded wave pool? To the untrained eye, drowning looks like swimming. The Instinctive Drowning Response is frequently missed, even by people nearby.
Life & fun · 2015 · spotthedrowningchild.com
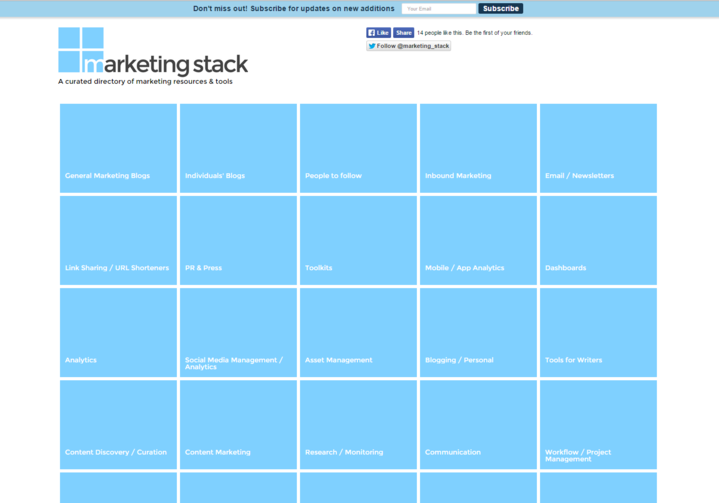

Docker implemented in around 100 lines of bash. Contribute to p8952/bocker development by creating an account on GitHub.
Dev tools · 2015 · github.com


Guida completa ai siti scommesse americani 2026: scopri i migliori bookmaker USA, licenze, bonus, sport americani, metodi pagamento e consigli utili.
AI · 2015 · whoishiring.it