Life & fun · September 14, 2014
Exploring the US Budget, 1962-2019
Exploring the US Budget, 1962-2019 launched on September 14, 2014 with 69 votes, #781 of 2,087 launches that month and more than 90% of that year's launches. The site was still online in September 2026, 12 years on.
In plain words
Exploring the US Budget, 1962-2019 is an interactive visualization tool that displays US Federal Budget data spanning nearly six decades. Users can navigate through different years using keyboard arrows, buttons, or a timeline graph to examine spending across categories and agencies. The tool allows drilling down into specific budget line items by clicking on visual elements, with results displayed in sortable tables organized by amount, function, and agency. The data comes from White House sources.
written from the facts on this page · September 2026
From the sources
This is a Beta interactive visualization of the US Federal Budget. The data is available from the White House . You can change years by using the left/right keyboard arrows, clicking the "year" buttons toward the upper left and right of the screen, or (if your device has a large enough screen) by clicking on the "mini" graph over time that is at the bottom of the page. With the exception of the deficit and "net interest" rectangles, you can drill down to line items for any year by clicking on the one of the rectangles, which will then show a table, sortable by amount, SubFunction, Agency, or Bureau. For each row of a detail table, you can click on the icon to display an interactive graph…from learnforeverlearn.com
Does a similar job
all alternatives → BudgetFlow – Budget planning using interactive Sankey diagrams2024 · budgetflow.cc · ▲275
Create stunning Sankey diagrams for your budget in minutes. Our visual budget planner helps you track expenses and plan investments with interactive, easy-to-understand flowcharts. Try BudgetFlow free today.
 Interactive California Budget (By Claude Code)Feb 2026 · california-budget.com · ▲39
There's been a lot of discussion around the california budget and some proposed tax policies, so I asked claude code to research the budget and turn it into an interactive dashboard. Using async subagents claude was able to research ~a dozen budget line items at once across multiple years, adding lots of helpful context and graphs to someone like me who was starting with little familiarity. It still struggles with frontend changes, but for research this probably 20-40x's my throughput. Let me know any additional data or visualizations that would be interesting to add!

- UPUnderstanding public spending – 700 tables of data in one diagram2015 · wikibudgets.org · ▲33
- F3Free 30-year financial statements visualization2022 · fintopea.com · ▲245
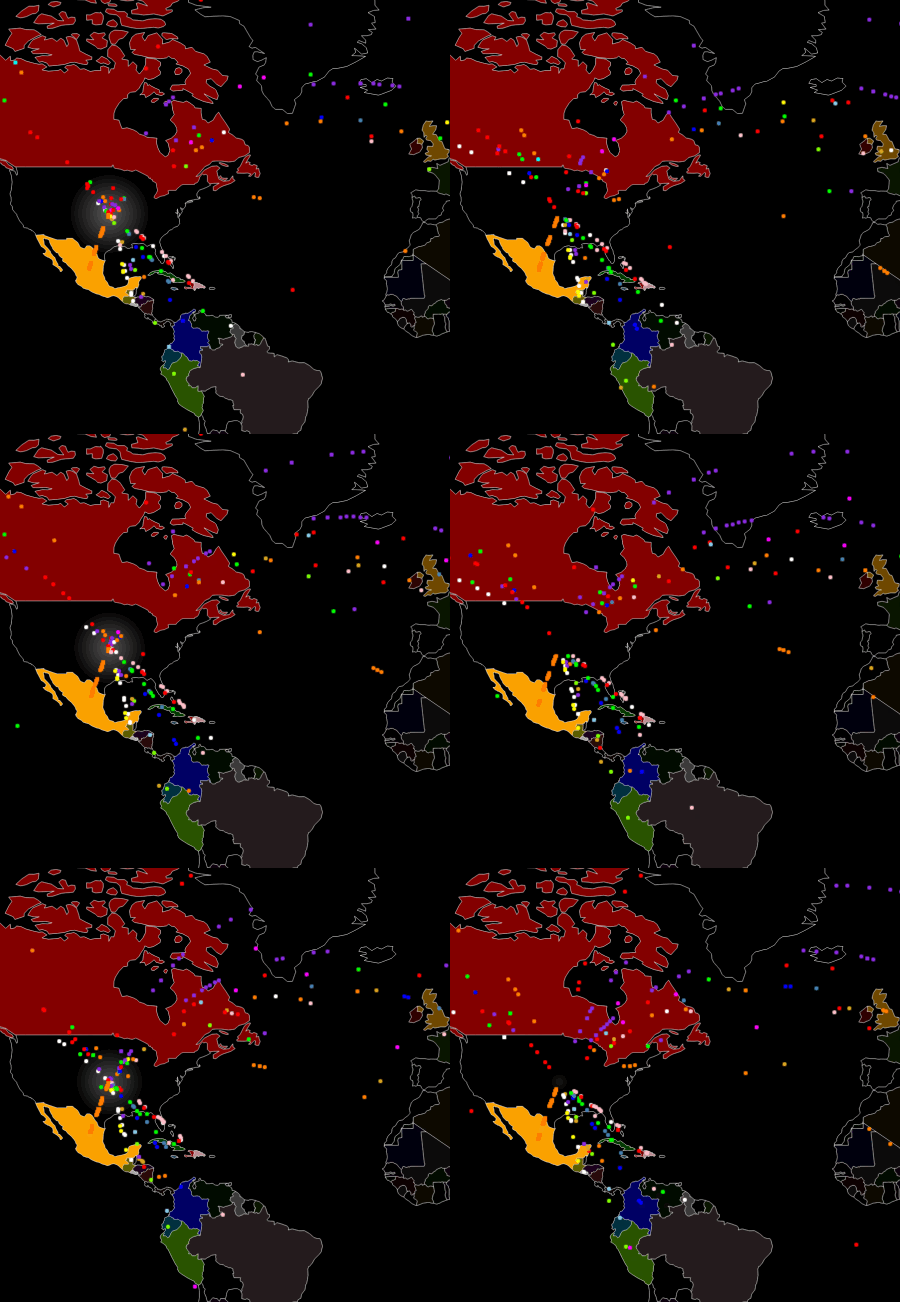 Two Centuries of U.S. Immigration2016 · ▲232
Visualizing who immigrated to the U.S. between 1820 and 2013
More life & fun this month
the category →
A free city-building game in your browser. You are the mayor. You know what the city needs. Now get it past the zoning board, the neighbors, the appeals court and the next election.
Life & fun · 2d ago · permit.petercai.com
- IV
Life & fun · 14d ago · tanzaniaeducationproject.org

Turn a phone, tablet or TV into a sign. Type a message and it fills the screen: welcome signs, timers, Wi-Fi passwords and more. No app, no account, free.
Life & fun · 15d ago · bigwords.page

Play a free virtual guitar online with your keyboard or by touch. Slow songs down and see every chord, string and strum. Acoustic, classic, electric and bass.
Life & fun · 9d ago · guitoro.com

Carrier settings from iPhone, Pixel and Galaxy firmware, decoded and compared: APNs, VoLTE, 5G and Wi-Fi Calling per carrier, and what each build changed.
Life & fun · 13d ago · carrierexplode.com

Life & fun · 23d ago · space.bl2.net
Source: Show HN post ↗
Launched alongside, September 2014
the whole month →


 Forest▲533
Put down your phone and stay focused. Or a tree will die. 🌳😵
Life & fun · 2014 · forestapp.cc

