Understanding public spending – 700 tables of data in one diagram
Understanding public spending – 700 tables of data in one diagram launched on March 11, 2015 with 33 votes, #1,076 of 2,697 launches that month and more than 90% of that year's launches.
In plain words
WikiBudgets is a tool that visualizes public spending data through a single diagram containing 700 tables of information. Launched in 2015, it helps citizens and researchers explore government finances by presenting complex budget data in an accessible, interactive format. The platform is designed for anyone interested in understanding how public money is allocated across different government departments and programs.
written from the facts on this page · September 2026
Does a similar job
all alternatives → Widgets for Stripe2024 · apps.apple.com · ▲709
Your revenue info at a glance in the coolest way possible
 BudgetFlow – Budget planning using interactive Sankey diagrams2024 · budgetflow.cc · ▲275
Create stunning Sankey diagrams for your budget in minutes. Our visual budget planner helps you track expenses and plan investments with interactive, easy-to-understand flowcharts. Try BudgetFlow free today.


- ETExploring the US Budget, 1962-20192014 · learnforeverlearn.com · ▲69

More life & fun this month
the category →
A free city-building game in your browser. You are the mayor. You know what the city needs. Now get it past the zoning board, the neighbors, the appeals court and the next election.
Life & fun · 3d ago · permit.petercai.com
- IV
Life & fun · 15d ago · tanzaniaeducationproject.org

Turn a phone, tablet or TV into a sign. Type a message and it fills the screen: welcome signs, timers, Wi-Fi passwords and more. No app, no account, free.
Life & fun · 16d ago · bigwords.page

Play a free virtual guitar online with your keyboard or by touch. Slow songs down and see every chord, string and strum. Acoustic, classic, electric and bass.
Life & fun · 10d ago · guitoro.com

Carrier settings from iPhone, Pixel and Galaxy firmware, decoded and compared: APNs, VoLTE, 5G and Wi-Fi Calling per carrier, and what each build changed.
Life & fun · 14d ago · carrierexplode.com

Life & fun · 24d ago · space.bl2.net
Source: Show HN post ↗
Launched alongside, March 2015
the whole month →

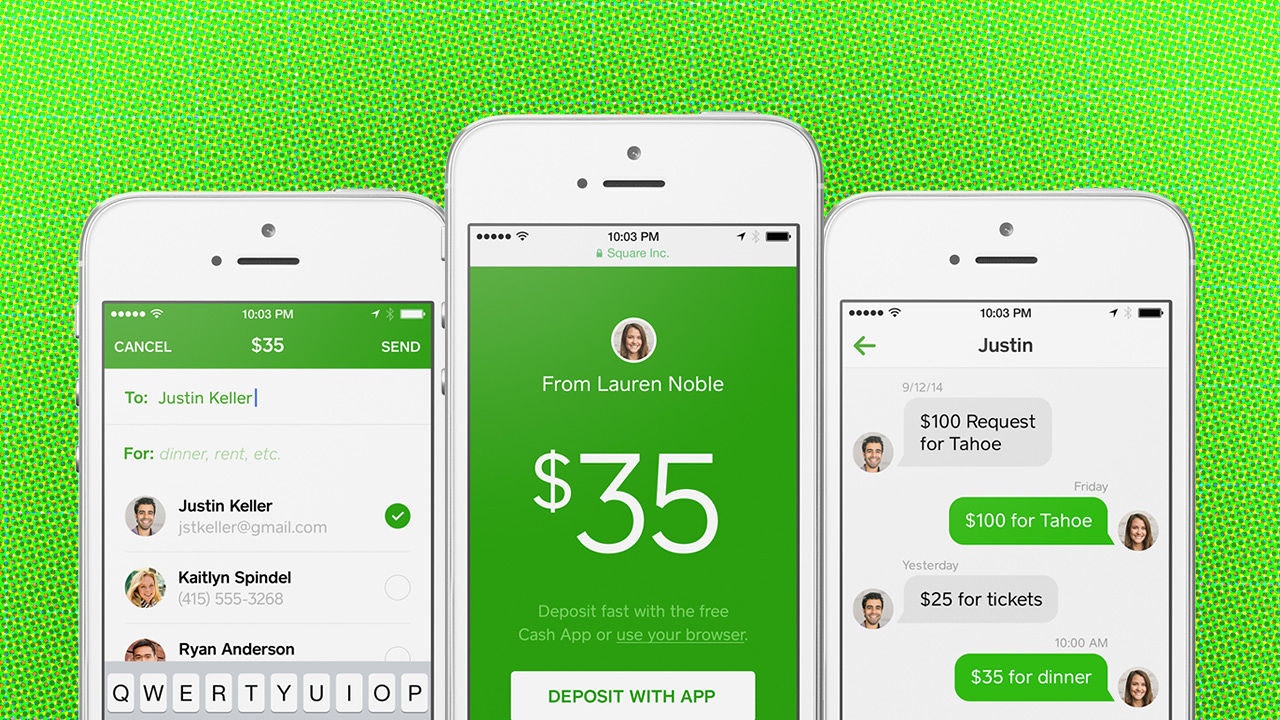
Get paid via $cashtags for things you do online or in person
Commerce · 2015 · t.co