
Visualising Data
Charts the development of the data visualisation field.
Visualising Data launched on April 22, 2016 with 1 votes. The site was still online in September 2026, 10 years on.
What it does
DATA VIZ EXCELLENCE, EVERYWHERE About Andy Hi, I’m ANDY KIRK, an independent data visualisation expert delivering a range of professional services to clients around the world. I specialise in data visualisation design training and consultancy, but alongside this I am a sought-after speaker, a four-times published author, and host of the ‘Explore Explain’ video and […]
Does a similar job
all alternatives →


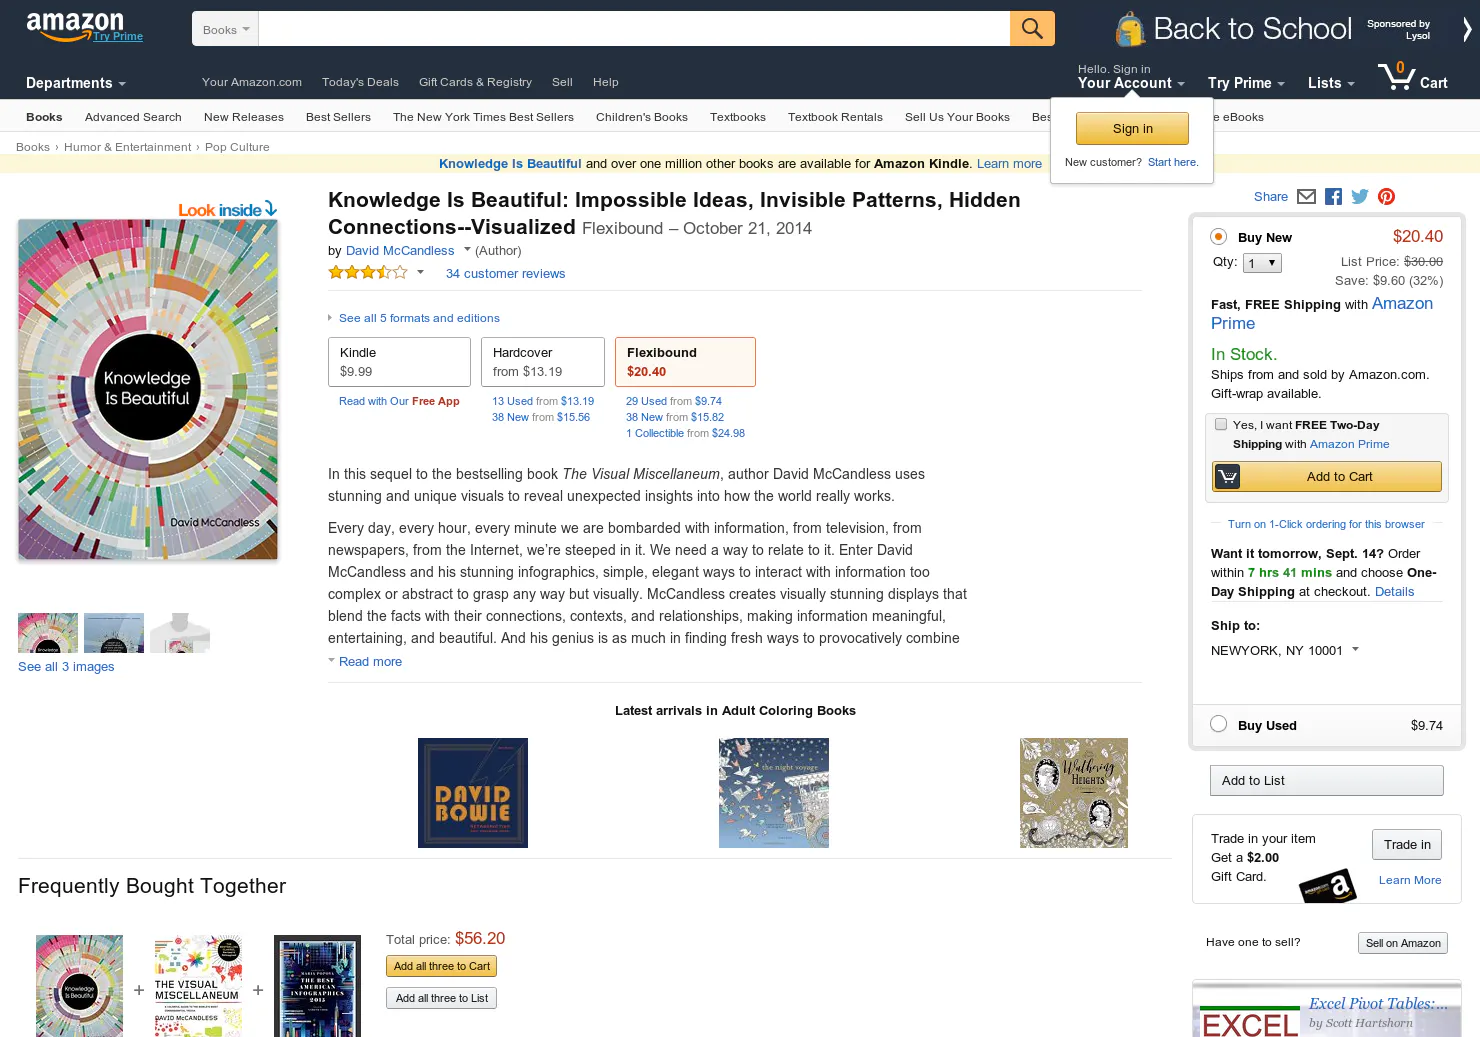 Knowledge is Beautiful2014 · amazon.com · ▲97
Taking infographics & data-visualisation next level (book)
 Information is Beautiful2015 · informationisbeautiful.net · ▲102
Ideas, issues, knowledge, data — visualized!
 The Data Visualisation Catalogue2016 · datavizcatalogue.com · ▲94
Reference tool for data visualisation
More life & fun this month
the category →
A free city-building game in your browser. You are the mayor. You know what the city needs. Now get it past the zoning board, the neighbors, the appeals court and the next election.
Life & fun · 7d ago · permit.petercai.com
- IV
Life & fun · 19d ago · tanzaniaeducationproject.org

Turn a phone, tablet or TV into a sign. Type a message and it fills the screen: welcome signs, timers, Wi-Fi passwords and more. No app, no account, free.
Life & fun · 20d ago · bigwords.page
 Steal My Bitcoin▲616
A PHP security challenge. Find the hidden bitcoin key. First person to get the wallet wins.
Life & fun · 3d ago · stealmybitcoin.com

Play a free virtual guitar online with your keyboard or by touch. Slow songs down and see every chord, string and strum. Acoustic, classic, electric and bass.
Life & fun · 14d ago · guitoro.com

Source: Product Hunt launch ↗
Launched alongside, April 2016
the whole month →


Access all the files on Dropbox without having to sync
Work · 2016 · blog.dropbox.com

The easiest way to build an FB bot. No coding required!
Dev tools · 2016

Quickly find your Bootstrap classes on this interactive Bootstrap cheat sheet. It includes code samples and live preview of elements.
Dev tools · 2016 · hackerthemes.com