AI · alternatives · 2026

24 alternatives to DataInfolab
Turn your spreadsheets into visual stories
Below are 24 products that do a similar job, ranked by how close each is in meaning and then by launch-day votes. Prices are shown for the 1 we have checked on their own sites, 1 of them free or with a free tier.
- 1

Free chart maker & visual exploration for spreadsheet data
2020 · its alternatives →
- 2

- 3
 DataSquirrel.ai▲268
Fastest way: csv/xls to dashboard report, no ChatGPT upload
2023 · datasquirrel.ai · its alternatives →
- 4
 Rows▲511
Import business data and analyze it using plain language.
2021 · rows.com · its alternatives →
- 5
 CSV Explorer▲137
Explore Spreadsheets with Millions of Rows
2018 · csvexplorer.com · its alternatives →
- 6
 OrangeLabs▲214
Analyze, interpret, and create interactive visuals from data
Mar 2026 · orangelabs.im · its alternatives →
- 7

- 8
 Excel Dashboard Aifree tier, from $7.43/mo▲158
Hey everyone! I'm Alex, the co-founder of Excel Dashboard Ai. I’m excited to share our AI tool that turns your Excel data into awesome dashboards and detailed reports. Think visualized charts, diverse analysis angles, and almost 10,000 words of AI-driven insights—all in one place. Say goodbye to endless hours of data analysis and report writing. ExcelDashboard is here to boost your productivity! Why did we build this? Back in my previous company, we were constantly asked for data-driven insights and long reports. This process was a huge time drain. I used to joke, "Wouldn't it be great if…
2024 · exceldashboard.ai · its alternatives →
- 9
 OpenSheet▲86
Hi folks. I've been doing some experiments on how LLMs could get more handy in the day to day of working with files (CSV, Parquet, etc). Earlier last year, I built https://datakit.page and evolved it over and over into an all in-browser experience with help of duckdb-wasm. Got loads of feedbacks and I think it turned into a good shape with being an adhoc local data studio, but I kept hearing two main things/issues: Why can't the AI also change cells in the file we give to it? Why can't we modify this grid ourselves? So besides the whole READ and text-to-SQL flows, what seemed…
Feb 2026 · opensheet.app · its alternatives →
- 10

- 11
 CSV Plot▲6
Turn Your CSV Data into Insights in Seconds.
Jan 2026 · csvplot.netlify.app · its alternatives →
- 12
 Vizician▲77
Drag & drop your data for instant visual data exploration
2022 · vizician.com · its alternatives →
- 13

- 14

- 15

The ultimate tool for automated marketing reporting in Excel
2019 · supermetrics.com · its alternatives →
- 16

- 17

Visualize your CSV, Excel, and JSON data
2025 · aaaenos.com · its alternatives →
- 18

- 19

- 20

Upload Excel. Get dashboards, charts & AI insights instantly
Jun 2026 · guffiinsight.lovable.app · its alternatives →
- 21
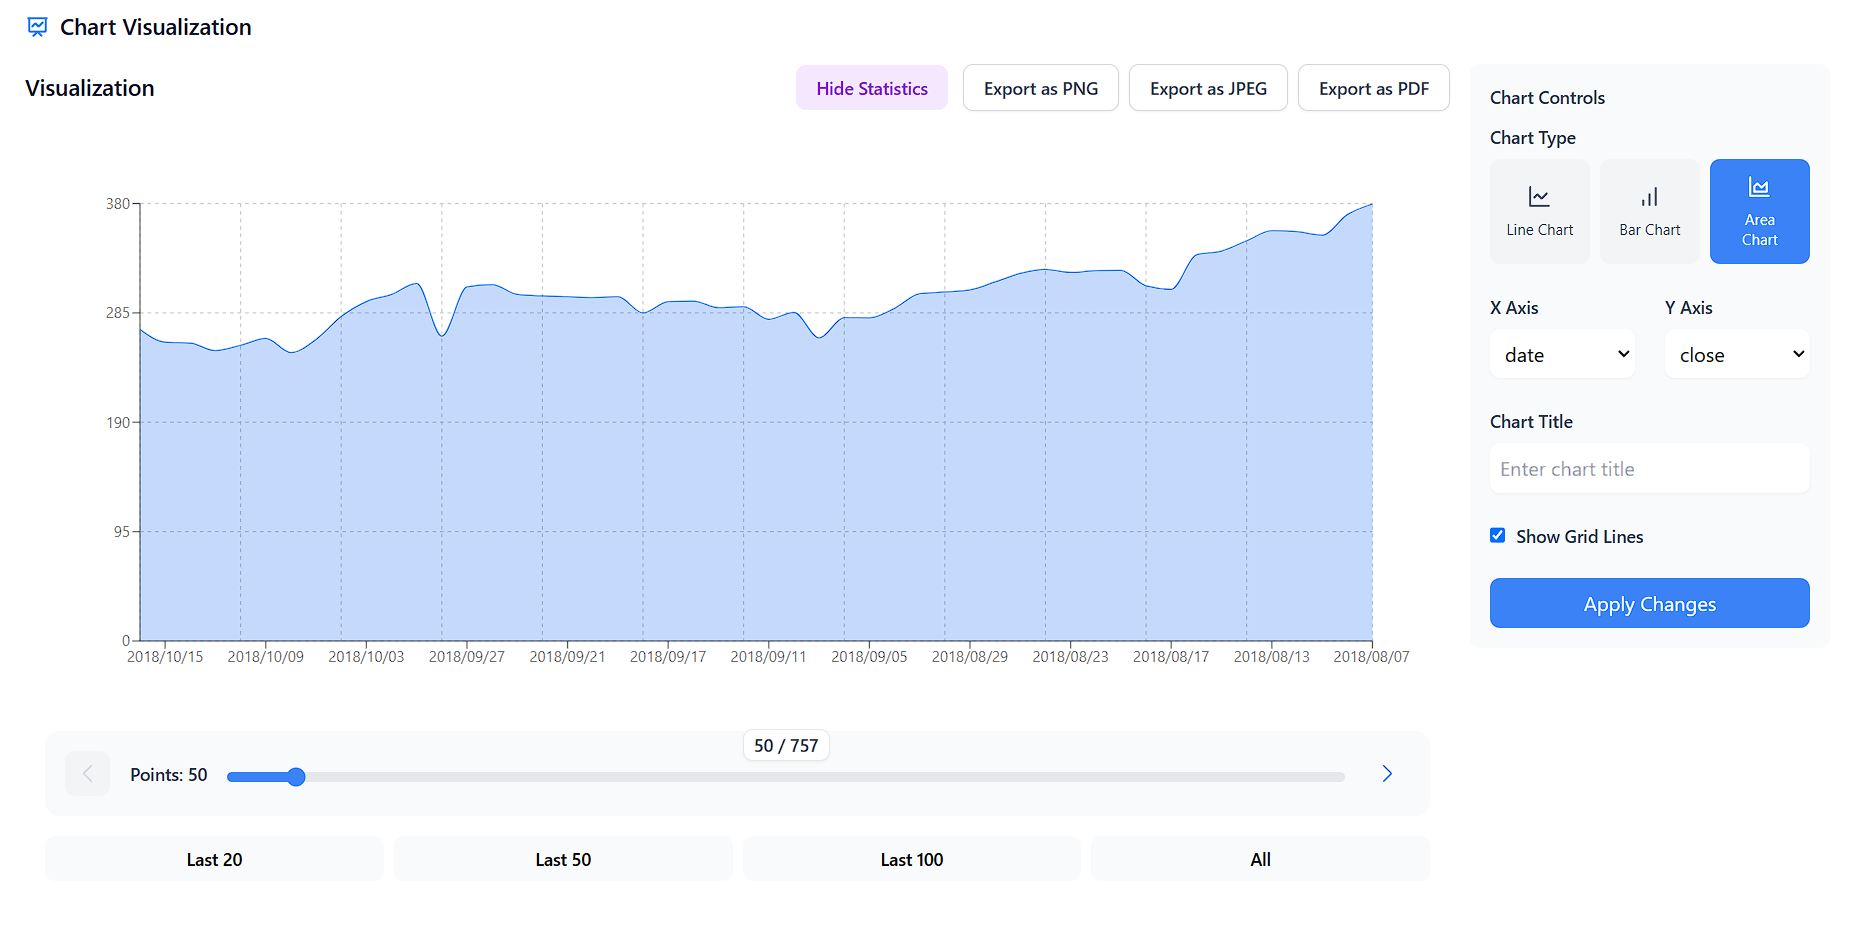
CSV Visualizer: Turn raw data into stunning visuals fast! 📊
2024 · csv-data-visualizer.netlify.app · its alternatives →
- 22

- 23
 Chart2Data▲15
Turn any chart into clean, usable data in seconds with AI
2025 · chart2data.com · its alternatives →
- 24

Turn Tables Into Stunning Graphs-No Coding, Just Clarity!
2025 · its alternatives →
Also compare
Ranked by how close each launch is in meaning, then by votes. Prices were read from each product’s own site when checked and can change. Refine with your own description →