Dev tools · alternatives · 2026
24 alternatives to GlobeKit
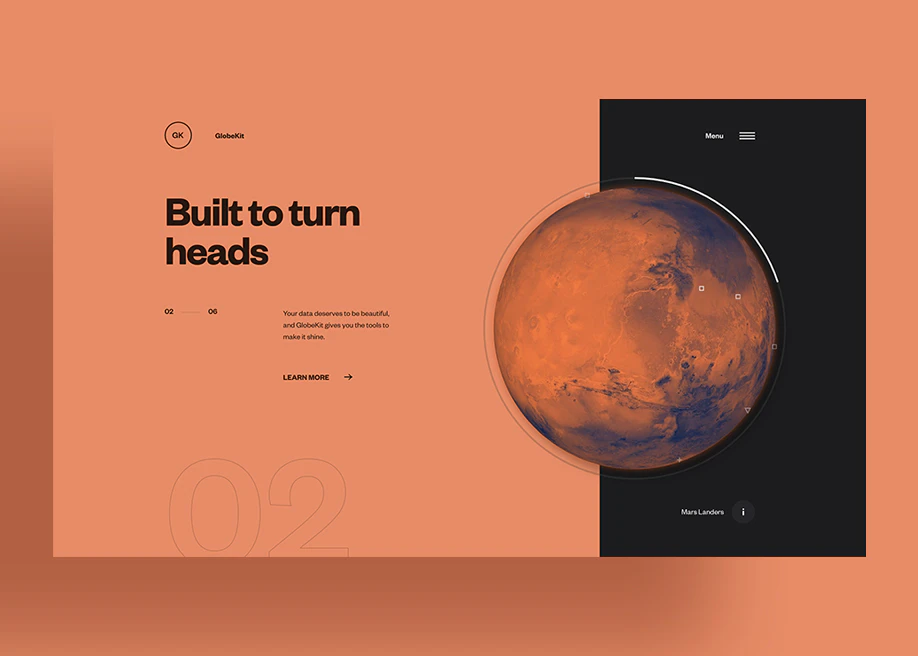
Enables developers to build animated + interactive globes
Below are 24 products that do a similar job, ranked by how close each is in meaning and then by launch-day votes. GlobeKit launched in 2020; newer entries below may have overtaken it.
- 1

Globe wireframe visualizations in Golang. Contribute to mmcloughlin/globe development by creating an account on GitHub.
2017 · github.com · its alternatives →
- 2
 ReactGlobe▲75
Build interactive globe visualizations with ease 🌎
2019 · react-globe.netlify.com · its alternatives →
- 3
 MapKit JS▲81
JavaScript API for interactive Apple maps
2018 · developer.apple.com · its alternatives →
- 4
 Globe 3D▲151
Convert your design into an interactive 3D globe
2021 · globe-3d.vercel.app · its alternatives →
- 5

- 6

- 7
 DrawKit▲369
Free & premium illustrations, animations, graphics & more
2022 · drawkit.com · its alternatives →
- 8

The interactive 3d globe plugin
2025 · globe-map.framer.website · its alternatives →
- 9
 Gio.js▲77
3D globe info visualization library built with Three.js
2018 · github.com · its alternatives →
- 10
 Globemallow▲69
Sustainable web development and design best practice reports
2022 · globemallow.io · its alternatives →
- 11
 City Kit▲377
Illustrated and animated cities from around the world
2019 · startupmilk.com · its alternatives →
- 12
 Flowkit▲296
Sketch library for user flows/content maps/annotations
2017 · useflowkit.com · its alternatives →
- 13
 Super Map World▲115
Hi HN I’ve been working on Super Map World, a creative mapping platform and just launched a new animation feature. Try it: https://supermap.world/tools/map-animation What it does: The feature lets you animate maps directly in your browser with a few clicks. You can animate routes, regions, or just simply see a globe in your chosen style rotate from point to point. It’s designed for people who want to make short visuals e.g. social clips, or storytelling maps without needing to figure out GIS tools. Under the hood: Everything runs client-side. I'm using d3.js to render the…
2023 · supermap.world · its alternatives →
- 14

Revolutionize GIS data management with Geoman for Leaflet, MapLibre, and Mapbox. Add drawing, editing, cutting, splitting, snapping, measuring, and more directly on the map.
2020 · geoman.io · its alternatives →
- 15

map33.js is a JavaScript library to build 3D maps. Made by Openbloc with three.js.
2020 · map33.openbloc.com · its alternatives →
- 16

I'm Robbert, the creator of DataGridXL.js. Last month I released version 2 which includes many new features. DataGridXL is a free (and commercial) editable data table library written in ES6. My goal is to develop the most performant & user-friendly spreadsheet-like data table out there: - It has zero dependencies. You don’t need any framework to use DataGridXL. - It is lightweight (~250kb) and easy to use. It does not even require messing with CSS. - It has its own Virtual DOM implementation to prevent DOM errors. - Developer friendly. Supports all modern web browsers Please take a look at…
2022 · datagridxl.com · its alternatives →
- 17
 GlobeKin▲107
A virtual playground for out-of-school learning
2024 · globekin.com · its alternatives →
- 18

- 19

A powerful JavaScript library for creating interactive 360-degree product views - scaleflex/cloudimage-360-view
2019 · github.com · its alternatives →
- 20
Create beautiful Google Trends globe visualizations
2019 · google-globe-trends.netlify.com · its alternatives →
- 21IE
2017 · mjmdavis.com · its alternatives →
- 22MA
The concept for metiq.space came after playing Global Magnates with friends and realizing how fragmented live global data is. ships, aircraft, satellites, ports, weather, hazards, infrastructure, cyber, and public datasets all exist, but they usually live in separate tools and maps. The goal was to build one interactive 3D globe where live public data could be visualized by latitude, longitude, and altitude. Surface data stays on the globe, while aircraft, satellites, and other above surface things can be represented in actual 3D space instead of being flattened onto a map. The outcome is an…
Jun 2026 · metiq.space · its alternatives →
- 23

A framework for 3D geospatial visualization in the browser - UDST/vizicities
2016 · github.com · its alternatives →
- 24

Also compare
Ranked by how close each launch is in meaning, then by votes. Prices were read from each product’s own site when checked and can change. Refine with your own description →