Life & fun · alternatives · 2026

24 alternatives to How bad is the corona virus?
Visualize how dangerous the exponential growth of COVID19 is
Below are 24 products that do a similar job, ranked by how close each is in meaning and then by launch-day votes. How bad is the corona virus? launched in 2020; newer entries below may have overtaken it.
- 1

- 2
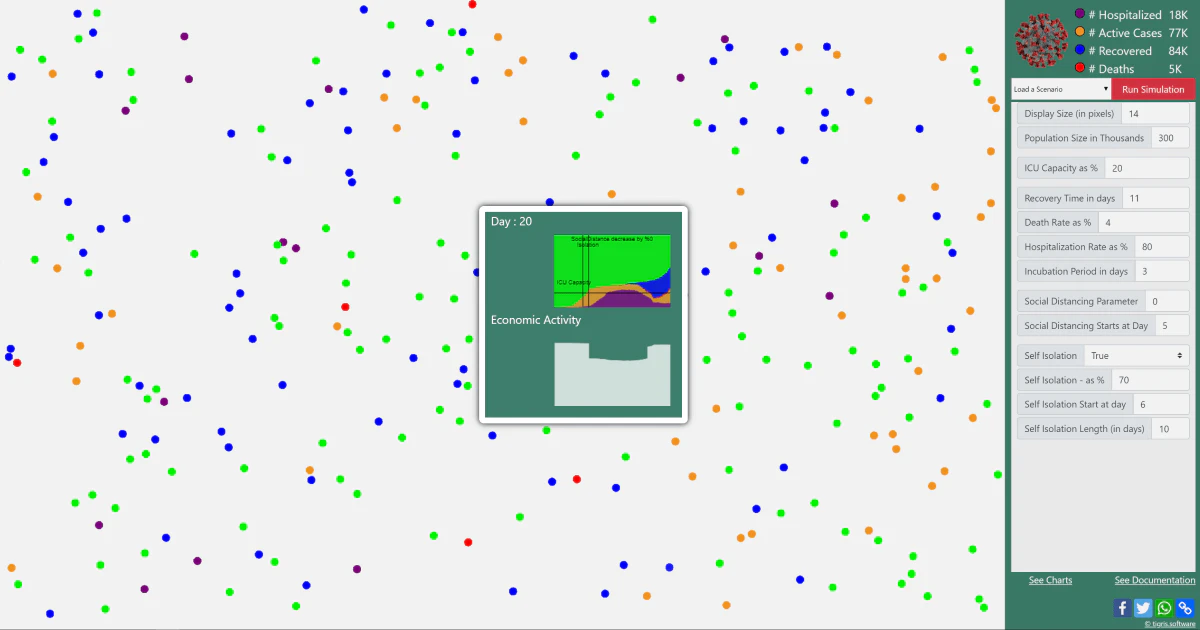
Simulate pandemic visually and test scenarios on browser.
2020 · its alternatives →
- 3

See what’s coming after the crisis ends.
2020 · explodingtopics.com · its alternatives →
- 4
 COVID-19 Trends▲260
See the growth and decline of topics affected by COVID-19
2020 · meetglimpse.com · its alternatives →
- 5

- 6

- 7

Real time coronavirus tracker with live news
2020 · coronastats.co · its alternatives →
- 8

Learn how you can help fight coronavirus - using math!🤓
2020 · flattenthecurve.herokuapp.com · its alternatives →
- 9

- 10

- 11

Visualisation of Coronavirus (COVID-19) spread over time on interactive map.
2020 · coronavirus.dreamonward.com · its alternatives →
- 12

- 13

Calculate your actual chances of dying from COVID-19
2020 · premade.outgrow.us · its alternatives →
- 14

- 15

Explore, visualize and play around with COVID 19 data to see where we are at in the pandemic, and what we can do to flatten the curve.
2020 · cream.io · its alternatives →
- 16TP
2020 · gieoon.github.io · its alternatives →
- 17

- 18

- 19

- 20

Community focused solution to track, stop COVID-19 near you
2020 · its alternatives →
- 21C1
Hello, HN! There have been a lot of COVID-19 from various sites, but a common complaint is that simple things like log-scaling population counts are are infrequently done. So I decided to do it: https://covid19.fernandes.org/ I've aggregated the JHU (per Country) and NYT (select US states) data and plotted them under two models: simple exponential growth and simple logistic growth. The plots are updated as the JHU and NYT data is updated (thanks, GitHub actions!). A big challenge has been the writeup because the exponential model implies horrific things, but the logistic model…
2020 · its alternatives →
- 22

A mobile-friendly dashboard to visualize the spread of the Coronavirus Disease (COVID-19) and compare it across different countries.
2020 · codelike.com · its alternatives →
- 23

A minimal & easy to use a version of coronavirus tracker
2020 · covid19.locale.ai · its alternatives →
- 24

Visualize how COVID is spreading in the US
2020 · its alternatives →
Also compare
Ranked by how close each launch is in meaning, then by votes. Prices were read from each product’s own site when checked and can change. Refine with your own description →