Life & fun · alternatives · 2026
24 alternatives to Learning D3
A course on building data visualizations with D3.js
Below are 24 products that do a similar job, ranked by how close each is in meaning and then by launch-day votes. Learning D3 launched in 2016; newer entries below may have overtaken it.
- 1

- 2IT
Experiments in expressing statistical thinking with interactive design
2015 · r2d3.us · its alternatives →
- 3HT
2019 · wattenberger.com · its alternatives →
- 4

- 5IA
2012 · latentflip.github.com · its alternatives →
- 6M3
2015 · gmarland.github.io · its alternatives →
- 7

Many JS libraries exist to build graphs on the web (Vega, chartJS, Plotly...). They allow to make charts quickly. But you lose flexibility: you're limited by the options they offer. I just created a gallery with hundreds of graphs made with d3.js and React. - Examples are split by graph types - They all come with explanation and code sandboxes - Gradual complexity to ease the learning curve It took me ages to create this project! Feedback welcome!
2023 · react-graph-gallery.com · its alternatives →
- 8

An interactive data visualisation about Exoplanets by TK Vishal
2019 · exoplanetexplore.now.sh · its alternatives →
- 9OS
2017 · medium.com · its alternatives →
- 10
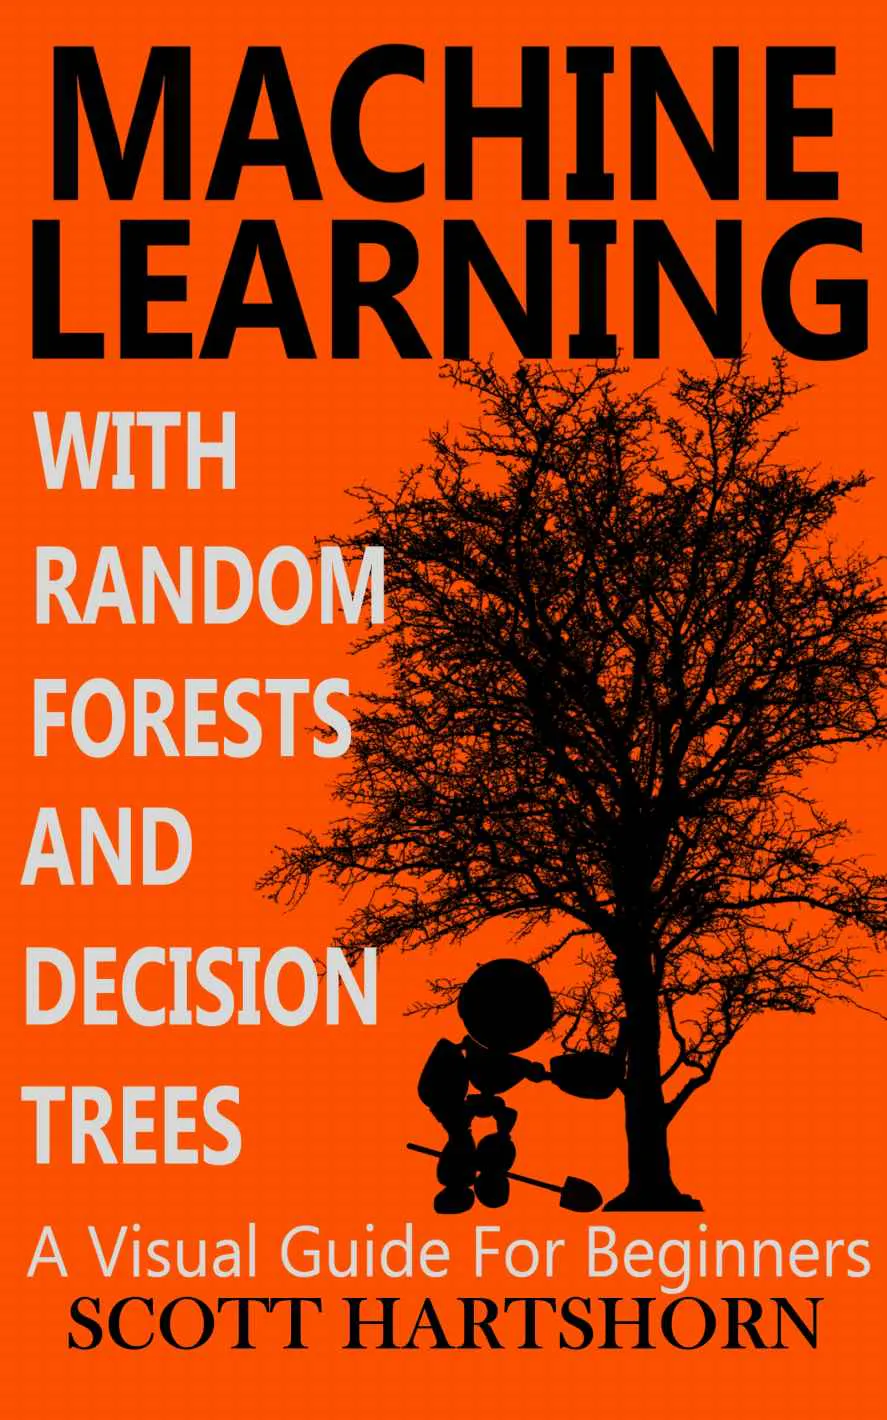
- 11

Over the weekend I was discussing the latest news relating to open weights with some of my non-techie friends. After 30 mins of waffling, I realised it is quite a long and interesting story, with many twists and turns. I've always wanted to create a 'long scroll' story, but have never found a suitable story to tell. This felt like a fun weekend project to undertake. The story itself doesn't have too many scroll effects (which is probably a good thing), it was more about trying to tell a story with a certain style that wouldn't really fit on my personal blog. Would love to get your feedback…
2020 · blog.scottlogic.com · its alternatives →
- 12

The essential collection of visualisation resources
2017 · visualisingdata.com · its alternatives →
- 13

- 14
Learn data science with a mentor.
2014 · mysliderule.com · its alternatives →
- 15

A guide for anyone who works with data
2017 · leanpub.com · its alternatives →
- 16
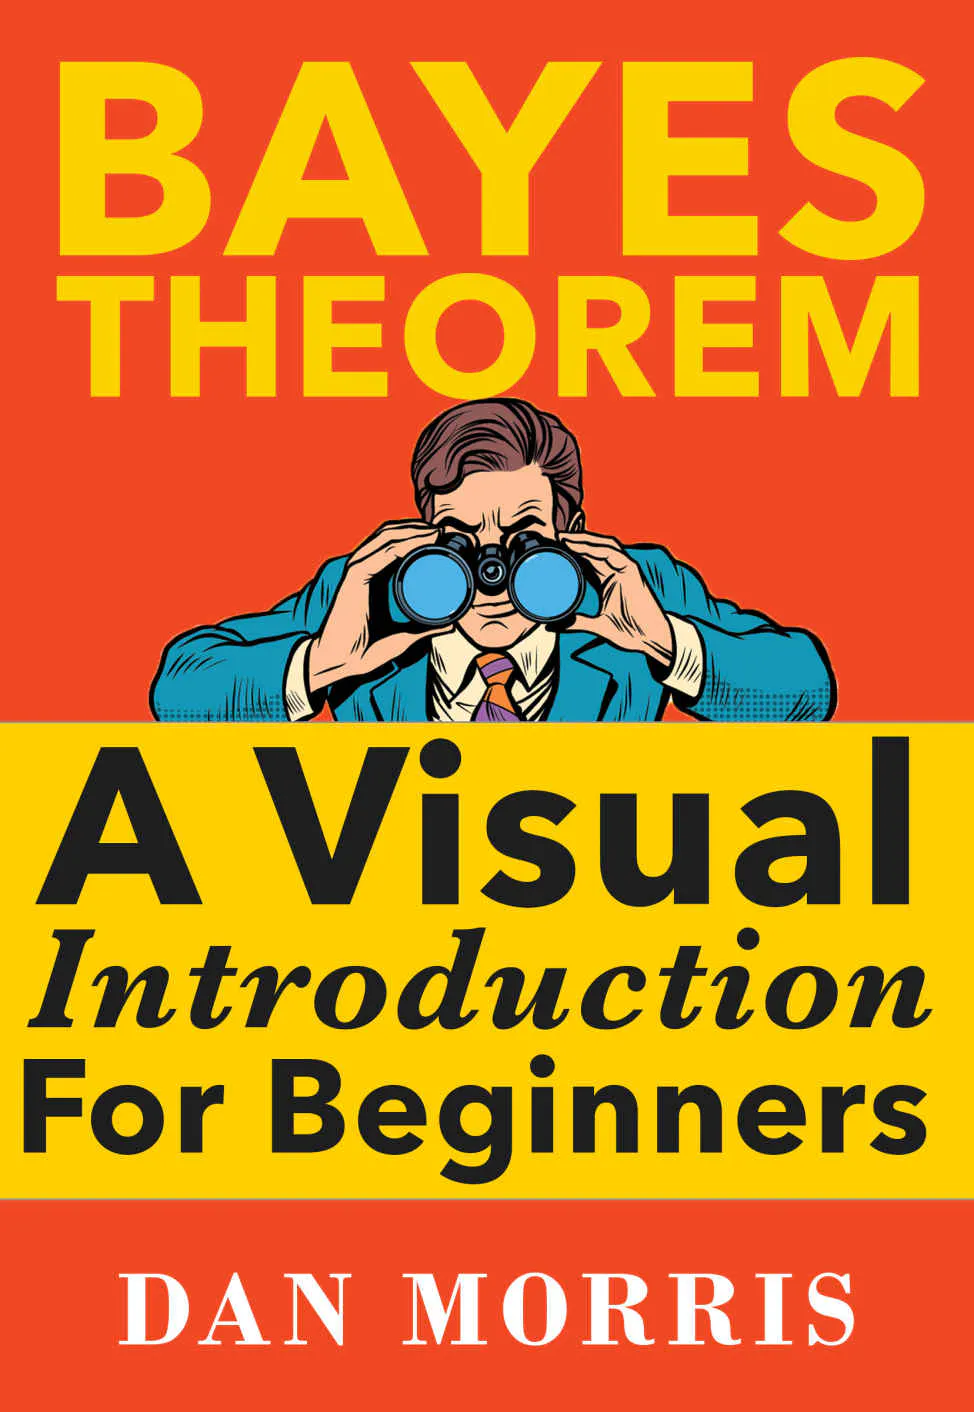
A beginners visual approach to Bayesian data analysis
2017 · amazon.com · its alternatives →
- 17GS
2014 · gridvisual.com · its alternatives →
- 18

The future of online data visualization tools
2016 · policyviz.com · its alternatives →
- 19
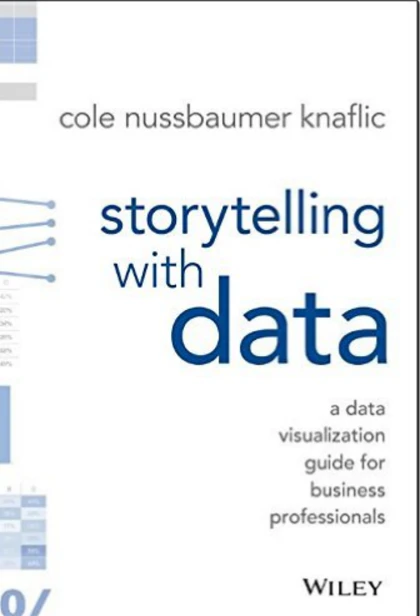
A data visualization guide for business professionals
2015 · amazon.com · its alternatives →
- 20

GitHub Gist: instantly share code, notes, and snippets.
2013 · bl.ocks.org · its alternatives →
- 21

Free chapters from a book by Stephen A. Thomas
2014 · jsdatav.is · its alternatives →
- 22
 Variance▲91
Build powerful data visualizations for the web.
2014 · variancecharts.com · its alternatives →
- 23
 Web Rewind▲98
An interactive journey through 30 years of the web
Mar 2026 · web-rewind.com · its alternatives →
- 24

Also compare
- D3.js alternatives
- Intro to Machine Learning in Interactive D3.js Visualizations alternatives
- How to learn D3.js, an in-depth guide and birds-eye view alternatives
- Datamatic alternatives
- Instrumenting and visualizing JavaScript with d3.js alternatives
- Mercer – 3D data visualization JavaScript library with three.js alternatives
Ranked by how close each launch is in meaning, then by votes. Prices were read from each product’s own site when checked and can change. Refine with your own description →