Life & fun · alternatives · 2026
24 alternatives to Market Share Visualizer (AngularJS + D3)
Below are 24 products that do a similar job, ranked by how close each is in meaning and then by launch-day votes. Market Share Visualizer (AngularJS + D3) launched in 2014; newer entries below may have overtaken it.
- 1
 Growthverse▲233
An interactive visualization of marketing tech tools
2015 · growthverse.com · its alternatives →
- 2
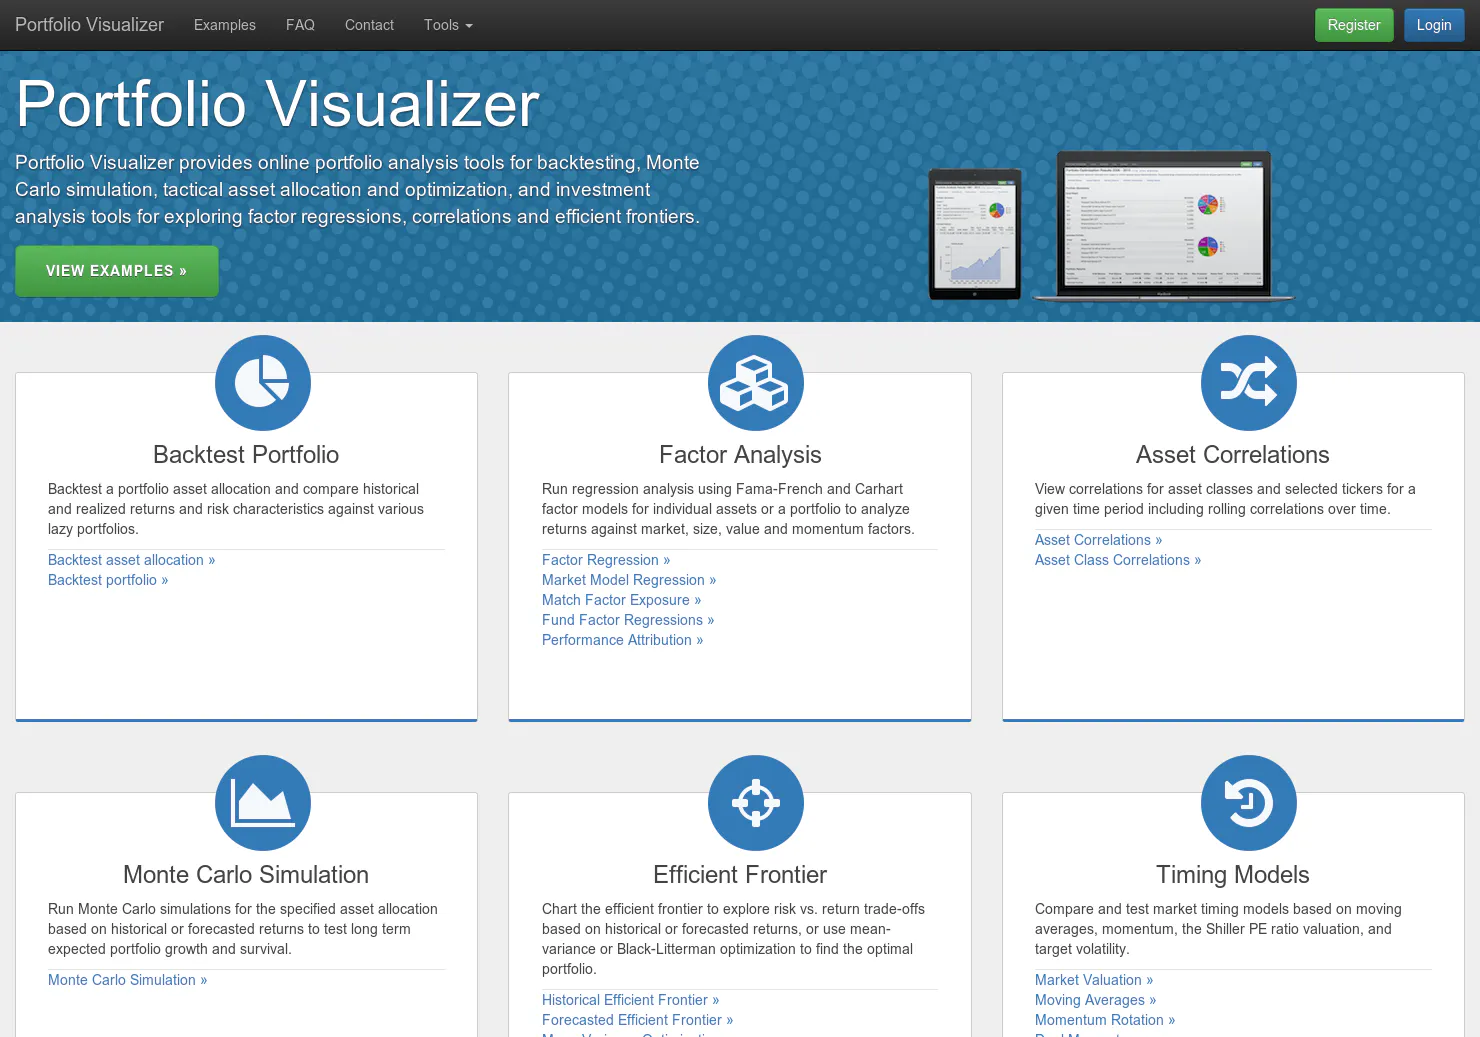
An index investor's dream come true
2014 · portfoliovisualizer.com · its alternatives →
- 3VT
2013 · appstorerankings.net · its alternatives →
- 4
 Variance▲91
Build powerful data visualizations for the web.
2014 · variancecharts.com · its alternatives →
- 5

GitHub Gist: instantly share code, notes, and snippets.
2013 · bl.ocks.org · its alternatives →
- 6AS
2014 · learnforeverlearn.com · its alternatives →
- 7MG
2012 · guildwars2viz.com · its alternatives →
- 8

- 9GR
I built this as part of my quest to properly learn data visualization. The code is the easy part! Some lessons learned: - personal verification of the the general truth that pie charts are tough! and the returns are not great for the effort due to people's difficulties perceiving angles - may not use "vanilla" d3 with no React. was difficult to adapt for mobile - the GitHub API provides fairly standardized responses so building dynamic charts wasn't too bad. But when working with streaming data (say Kafka) I can see this getting interesting... schema registry should help but creating a view…
2024 · see-my-repo.netlify.app · its alternatives →
- 10

The future of online data visualization tools
2016 · policyviz.com · its alternatives →
- 11GS
2014 · gridvisual.com · its alternatives →
- 12ND
2014 · blog.spritesapp.com · its alternatives →
- 13CA
2015 · dcochran.com · its alternatives →
- 14OS
2017 · medium.com · its alternatives →
- 15MA
2018 · easyinfograph.com · its alternatives →
- 16M3
2015 · gmarland.github.io · its alternatives →
- 17

- 18AD
2014 · coinsight.co · its alternatives →
- 19GV
An attempt to show which financial products are highly correlated, negatively correlated, or non-correlated in an easily understood visual way. Implemented using D3 force-layout, based on daily financial data generated by Google Sheet GOOGLEFINANCE function.
2023 · observablehq.com · its alternatives →
- 20HT
2019 · wattenberger.com · its alternatives →
- 21

The essential collection of visualisation resources
2017 · visualisingdata.com · its alternatives →
- 22VO
2017 · cointradeanalysis.com · its alternatives →
- 23US
2015 · imaginea.github.io · its alternatives →
- 24BS
2015 · pizzacharts.com · its alternatives →
Also compare
Ranked by how close each launch is in meaning, then by votes. Prices were read from each product’s own site when checked and can change. Refine with your own description →