Work · alternatives · 2026
24 alternatives to Plotzer
Advanced data visualization in your browser
Below are 24 products that do a similar job, ranked by how close each is in meaning and then by launch-day votes. Prices are shown for the 1 we have checked on their own sites, 1 of them free or with a free tier. Plotzer launched in 2023; newer entries below may have overtaken it.
- 1

Creating data visualizations with AI nowadays often means chat, chat and more chats...and writing long prompts can be annoying while they are also not the most effective way to describe your visualization designs. Data Formulator blends UI interaction with natural language so that you can create visualizations with AI much more effectively! You can: * create rich visualizations beyond initial datasets, where AI helps transforming and visualizing data along the way * iterate your designs and dive deeper using data threads, a new way to manage your conversation with AI. Here is a demo video:…
2024 · github.com · its alternatives →
- 2

Create pro-level graphs that drive actions
2024 · graphy.app · its alternatives →
- 3
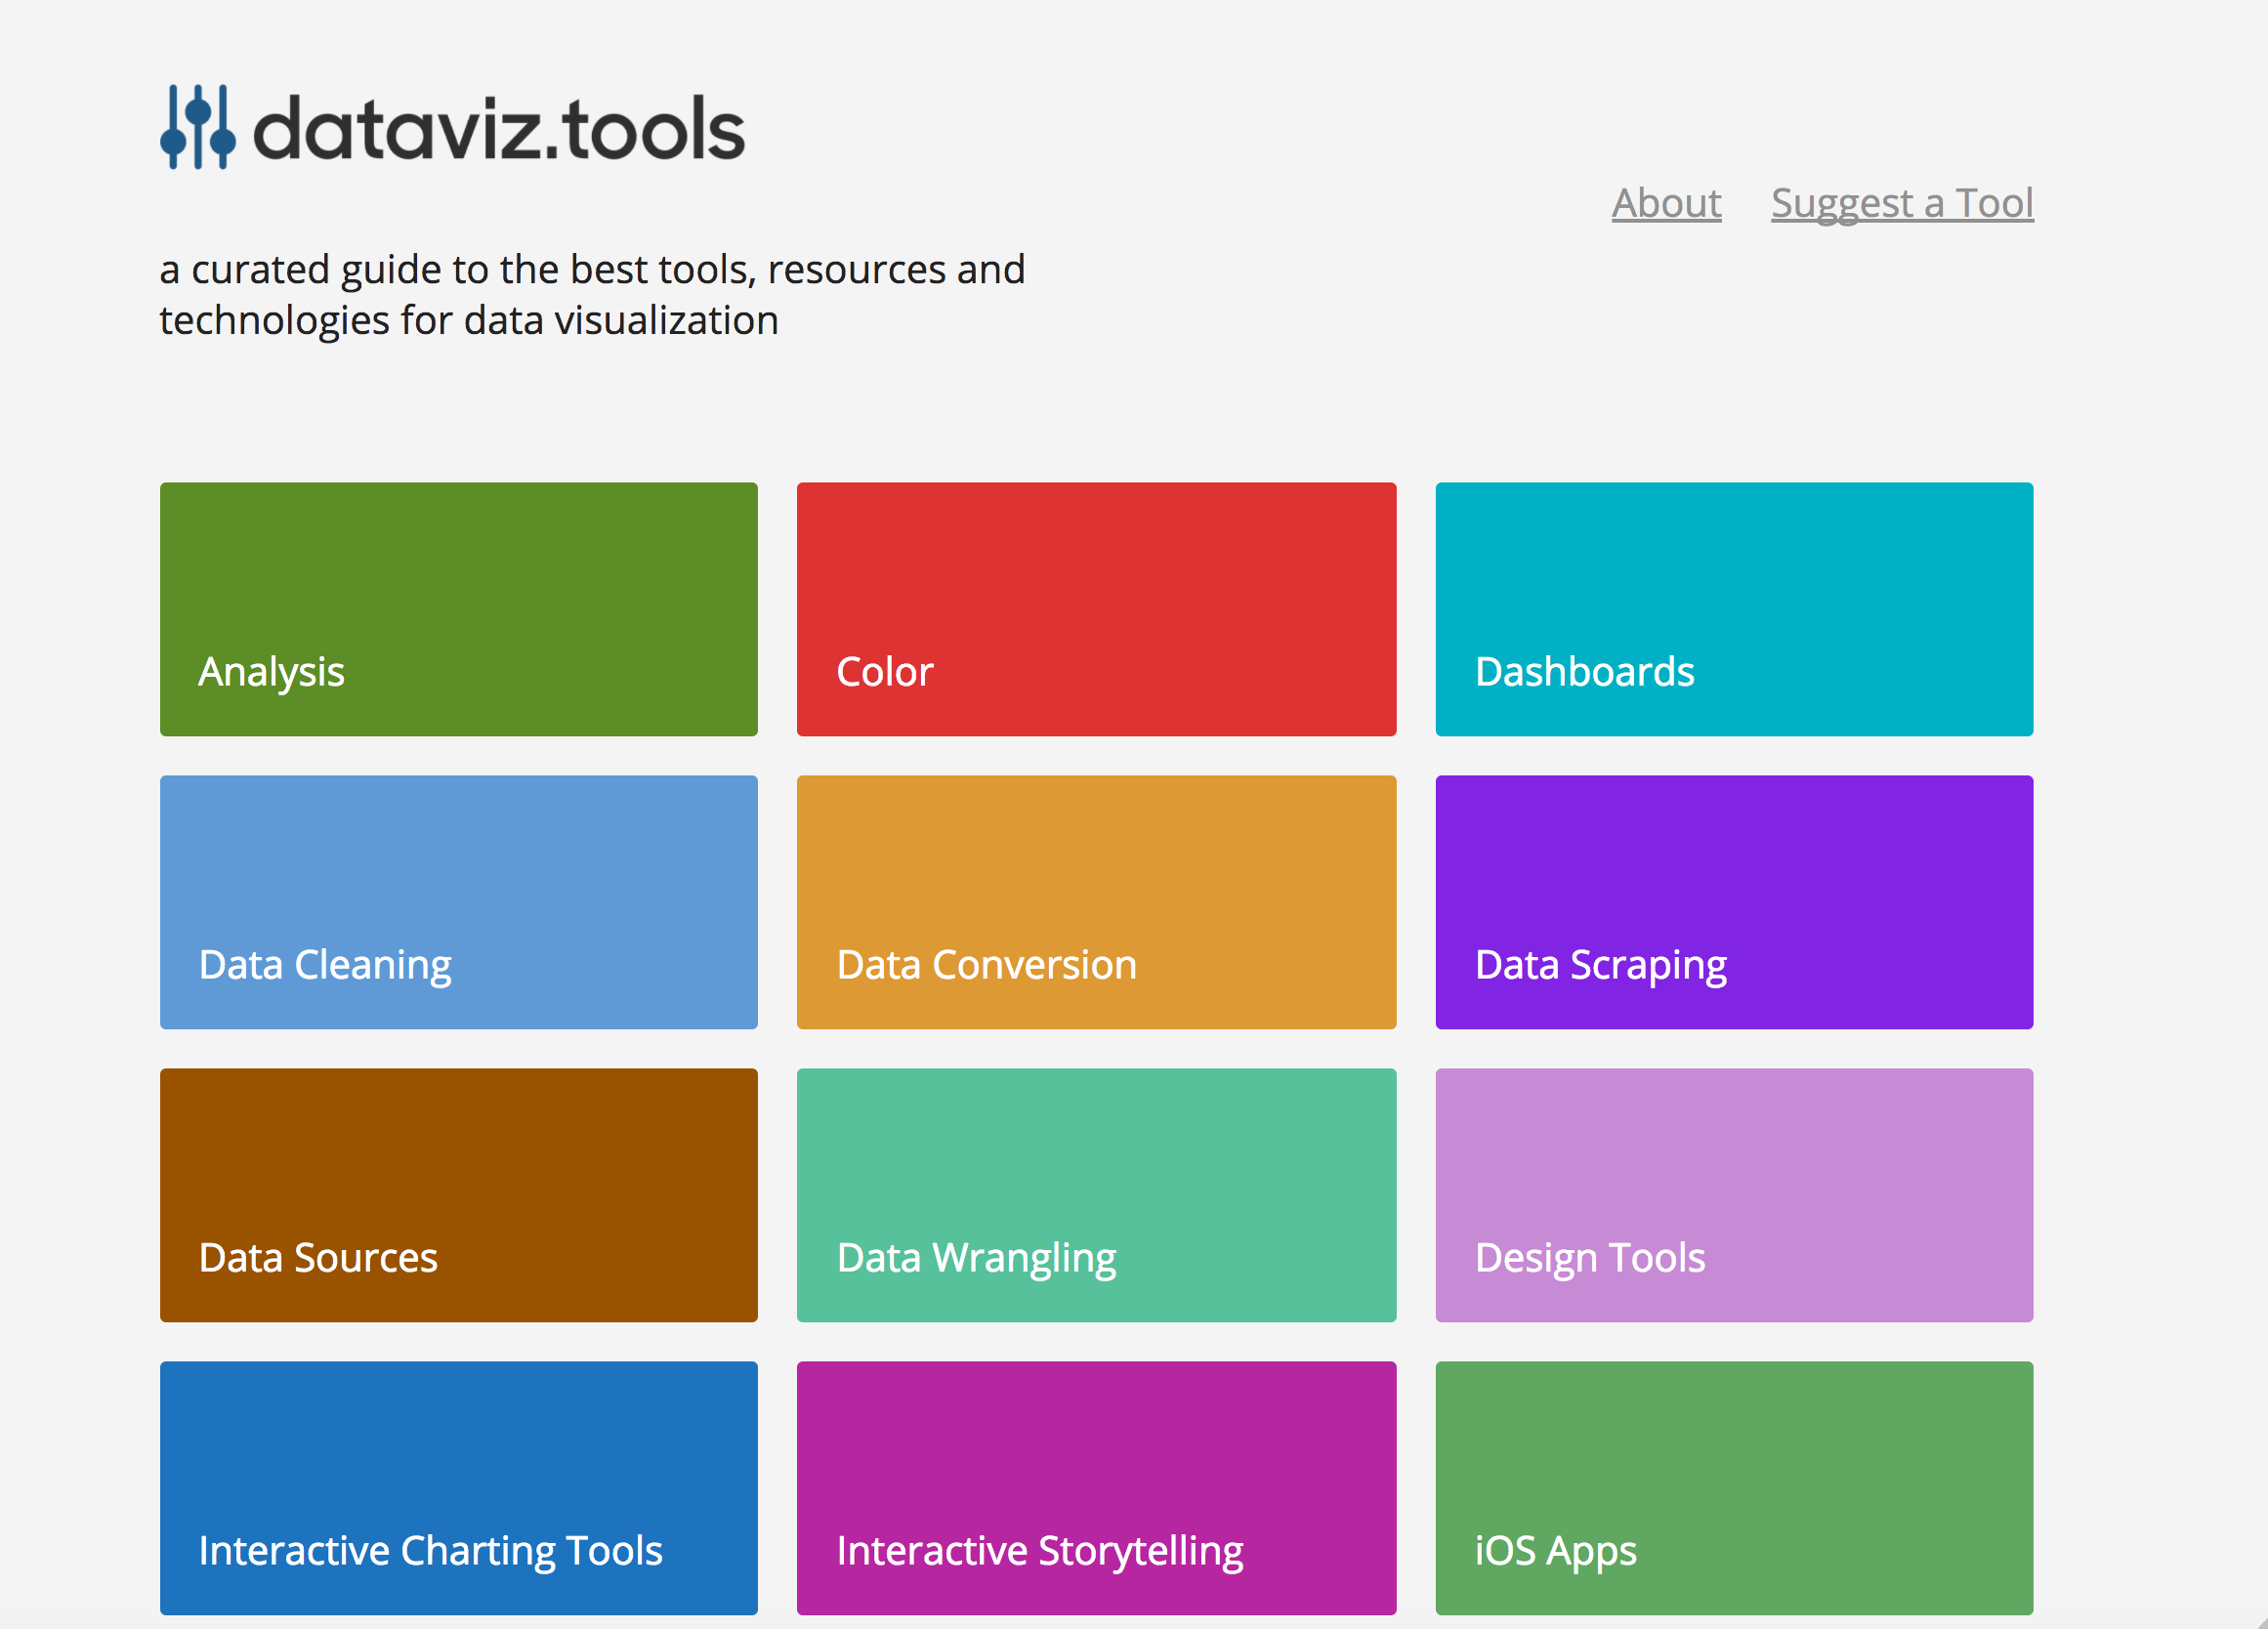 dataviz.tools▲409
Curated collection of the 400 best data visualization tools
2017 · dataviz.tools · its alternatives →
- 4
 Plottable.js▲132
Flexible, interactive charts for the web.
2016 · plottablejs.org · its alternatives →
- 5TL
2018 · charts.com · its alternatives →
- 6IB
grafar is a JavaScript library for creating visualizations on the web, with 3D support via WebGL. Built for mathematical plotting, but also can also handle data visualization.
2021 · thoughtspile.github.io · its alternatives →
- 7LS
2016 · plotti.co · its alternatives →
- 8

Hello, guys~ I recently developed a data exploration and visualization app which can be used as a different type of open-source alternative to Tableau. It is extremely easy to embed in your apps just as a react component. The original purpose is to develop a lite plugin that can be easily embedded in most cases, it doesn't have to be a large BI, but a lite graphic plugin. GitHub: Kanaries/graphic-walker, https://github.com/Kanaries/graphic-walker The main features implemented: * A user-friendly drag-and-drop-based interaction for exploratory data analysis with…
2023 · github.com · its alternatives →
- 9

Write down your algorithm to be visualized
2016 · jasonpark.me · its alternatives →
- 10
 ADS-B visualizer▲339
I've created a web app for querying and visualization of ADS-B datasets: https://adsb.exposed/ Source code: https://github.com/ClickHouse/adsb.exposed/ The results significantly exceeded my expectations because the pictures are insanely beautiful, and the data is a treasure trove. It proves many statements that were not certain: - it is feasible to generate tiles by aggregation on a pixel level (instead of hexagons or rectangular grid); - it does not require JPG/PNG tiles - we can transfer raw bitmap data with zstd compression; - it is possible to…
2024 · adsb.exposed · its alternatives →
- 11
 ChartPixel▲80
Extract & visualize key insights from raw data in seconds!
2024 · chartpixel.com · its alternatives →
- 12

- 13
 ChartURL▲272
Create image charts on the fly for web, mobile, and email
2015 · charturl.com · its alternatives →
- 14

The future of online data visualization tools
2016 · policyviz.com · its alternatives →
- 15

- 16

Fast by default, flexible 2D plotting library. Contribute to wwwtyro/candygraph development by creating an account on GitHub.
2021 · github.com · its alternatives →
- 17

- 18

Charts and infographics constructor in Figma
2021 · store.123d.one · its alternatives →
- 19
 Chartbrew v2▲197
Visualize data from all your data sources in one place
2022 · chartbrew.com · its alternatives →
- 20

- 21

Engineer - Hacker - Technology Addict
2014 · jackhanford.com · its alternatives →
- 22

Web app that visualizes data structures in action
2025 · datastructuresvisualization.netlify.app · its alternatives →
- 23DP
Data Painter is RATH's new feature to interact with your data. It helps you to specify complex visual patterns and find explanations and potential causals. It allows you to do on-flight data labeling, cleaning or even create new features does not exited in original dataset. Everything can be done with a brush tool(painter), You can even play with your data with your fingers on mobile. RATH is an open-source alternative to Tableau, but with more automations. Feedbacks and suggestions are appreciated. RATH's Github: https://github.com/Kanaries/Rath RATH's HomePage:…
2023 · docs.kanaries.net · its alternatives →
- 24
 The Visualizer▲167
Empower your learning and creativity through AI
2023 · getmindmap.com · its alternatives →
Also compare
Ranked by how close each launch is in meaning, then by votes. Prices were read from each product’s own site when checked and can change. Refine with your own description →